Opened 3 years ago
Closed 3 years ago
#51 closed defect (fixed)
Number of php5-fpm processes on Crin2
| Reported by: | chris | Owned by: | chris |
|---|---|---|---|
| Priority: | major | Milestone: | Maintenance |
| Component: | crin2 | Version: | |
| Keywords: | Cc: | peter | |
| Estimated Number of Hours: | 0 | Add Hours to Ticket: | 0 |
| Billable?: | yes | Total Hours: | 5.05 |
Description (last modified by chris)
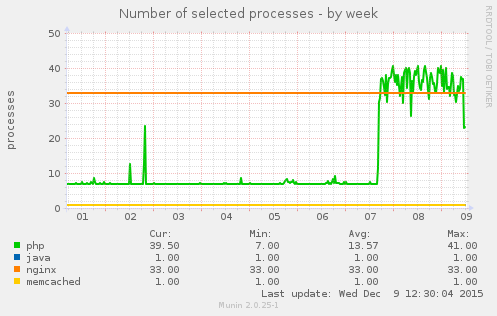
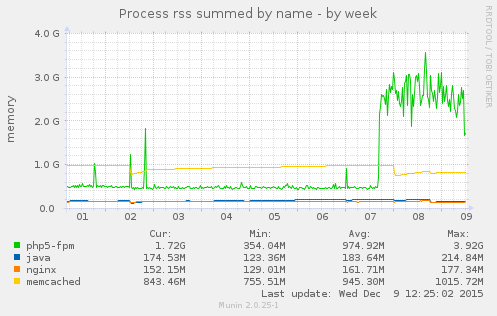
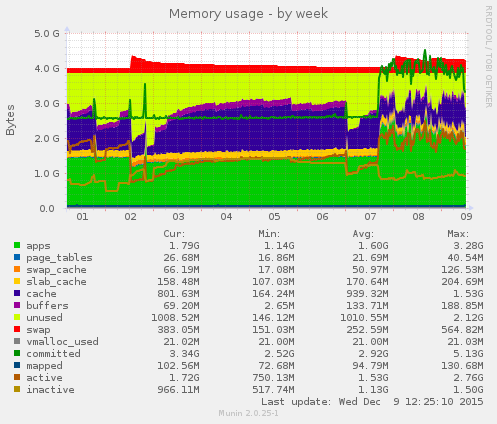
Peter -- a couple of days ago the number of php5-fpm processes on Crin2 jumped from 9 to 39 and this uses upto 5G or RAM and there is only 4G, see the following Munin graphs:
Note: See TracTickets for help on using tickets.
Any idea what changed?
Attachments (13)
Change History (37)
Changed 3 years ago by chris
Changed 3 years ago by chris
Changed 3 years ago by chris
comment:1 Changed 3 years ago by chris
- Add Hours to Ticket changed from 0 to 0.25
- Description modified (diff)
- Total Hours set to 0.25
comment:2 Changed 3 years ago by chris
- Summary changed from Number of php5-fpm processes onj Crin2 to Number of php5-fpm processes on Crin2
Changed 3 years ago by chris
Changed 3 years ago by chris
Changed 3 years ago by chris
Changed 3 years ago by chris
comment:3 Changed 3 years ago by chris
- Add Hours to Ticket changed from 0 to 0.25
- Total Hours changed from 0.25 to 0.5
comment:4 Changed 3 years ago by chris
- Description modified (diff)
comment:5 Changed 3 years ago by chris
- Description modified (diff)
comment:13 follow-up: ↓ 14 Changed 3 years ago by peter
On Monday I tested a change to the search form, but rolled back any of the
updates. Today I have implemented a number of small config changes.

There seems to be a serious caching issue. Any change on the site seems to
completely break the cache.

On 9 December 2015 at 12:38, CRIN Trac <trac@trac.crin.org> wrote:

> #51: Number of php5-fpm processes onj Crin2
> ------------------------------------+-----------------------------------
>                  Reporter:  chris   |                Owner:  chris
>                      Type:  defect  |               Status:  new
>                  Priority:  major   |            Milestone:  Maintenance
>                 Component:  crin2   |              Version:
>                Resolution:          |             Keywords:
> Estimated Number of Hours:  0       |  Add Hours to Ticket:  0.25
>                 Billable?:  1       |          Total Hours:  0
> ------------------------------------+-----------------------------------
> Changes (by chris):
>
>  * hours:  0 => 0.25
>  * totalhours:   => 0.25
>
>
> Old description:
>
> > Peter -- a couple of days ago the number of `php5-fpm` processes on
> > [[Crin2] jumped from 9 to 39 and this uses upto 5G or RAm and there is
> > only 4G, see the following Munin graphs:
> >
> > Any idea what changed?
>
> New description:
>
>  Peter -- a couple of days ago the number of `php5-fpm` processes on
>  [[Crin2] jumped from 9 to 39 and this uses upto 5G or RAm and there is
>  only 4G, see the following
>  [https://munin.crin.org/munin/crin.org/crin2.crin.org/index.html Munin
>  graphs]:
>
>  [[Image(crin2_multips-week.png)]]
>  [[Image(crin2_multips_memory-week.png)]]
>  [[Image(crin2_memory-week.png)]]
>
>  Note: See TracTickets for help on using tickets.
>
>  Any idea what changed?
>
> --
>
> --
> Ticket URL: <https://trac.crin.org.archived.website/trac/ticket/51#comment:1>
> CRIN Trac <https://trac.crin.org.archived.website/trac>
> Trac project for CRIN website and servers.
>


--
===============================================================
Code Positive Ltd.                              Drupal +
http://codepositive.com
Skills.Networks.Process.Development

Office: 0207 987 3928
Mobile: 07971 478 482
Skype: the-greenman
twitter: @greenman
comment:14 in reply to: ↑ 13 Changed 3 years ago by chris
- Add Hours to Ticket changed from 0 to 0.1
- Total Hours changed from 0.5 to 0.6
Replying to peter:
On Monday I tested a change to the search form, but rolled back any of the
updates. Today I have implemented a number of small config changes.
There seems to be a serious caching issue. Any change on the site seems to
completely break the cache.
Changes in the PHP / config files should be followed by a php5-fpm restart due to the OPCache -- was this done, if not I could do it now.
Perhaps a memcache restart is also needed, I'm not 100% sure about that.
comment:15 Changed 3 years ago by peter
This was the same issue we had when I attempted to deploy the mailchimp
module. That however is not enabled.

Drupal page cache does seem to be working.


On 9 December 2015 at 13:10, CRIN Trac <trac@trac.crin.org> wrote:

> #51: Number of php5-fpm processes on Crin2
> ------------------------------------+-----------------------------------
>                  Reporter:  chris   |                Owner:  chris
>                      Type:  defect  |               Status:  new
>                  Priority:  major   |            Milestone:  Maintenance
>                 Component:  crin2   |              Version:
>                Resolution:          |             Keywords:
> Estimated Number of Hours:  0       |  Add Hours to Ticket:  0
>                 Billable?:  1       |          Total Hours:  0.5
> ------------------------------------+-----------------------------------
>
> Comment (by peter):
>
>  {{{
>  On Monday I tested a change to the search form, but rolled back any of the
>  updates. Today I have implemented a number of small config changes.
>
>  There seems to be a serious caching issue. Any change on the site seems to
>  completely break the cache.
>
>  On 9 December 2015 at 12:38, CRIN Trac <trac@trac.crin.org> wrote:
>
>  > #51: Number of php5-fpm processes onj Crin2
>  > ------------------------------------+-----------------------------------
>  >                  Reporter:  chris   |                Owner:  chris
>  >                      Type:  defect  |               Status:  new
>  >                  Priority:  major   |            Milestone:  Maintenance
>  >                 Component:  crin2   |              Version:
>  >                Resolution:          |             Keywords:
>  > Estimated Number of Hours:  0       |  Add Hours to Ticket:  0.25
>  >                 Billable?:  1       |          Total Hours:  0
>  > ------------------------------------+-----------------------------------
>  > Changes (by chris):
>  >
>  >  * hours:  0 => 0.25
>  >  * totalhours:   => 0.25
>  >
>  >
>  > Old description:
>  >
>  > > Peter -- a couple of days ago the number of `php5-fpm` processes on
>  > > [[Crin2] jumped from 9 to 39 and this uses upto 5G or RAm and there is
>  > > only 4G, see the following Munin graphs:
>  > >
>  > > Any idea what changed?
>  >
>  > New description:
>  >
>  >  Peter -- a couple of days ago the number of `php5-fpm` processes on
>  >  [[Crin2] jumped from 9 to 39 and this uses upto 5G or RAm and there is
>  >  only 4G, see the following
>  >  [https://munin.crin.org/munin/crin.org/crin2.crin.org/index.html Munin
>  >  graphs]:
>  >
>  >  [[Image(crin2_multips-week.png)]]
>  >  [[Image(crin2_multips_memory-week.png)]]
>  >  [[Image(crin2_memory-week.png)]]
>  >
>  >  Note: See TracTickets for help on using tickets.
>  >
>  >  Any idea what changed?
>  >
>  > --
>  >
>  > --
>  > Ticket URL: <https://trac.crin.org.archived.website/trac/ticket/51#comment:1>
>  > CRIN Trac <https://trac.crin.org.archived.website/trac>
>  > Trac project for CRIN website and servers.
>  >
>
>
>
>  --
>  ===============================================================
>  Code Positive Ltd.                              Drupal +
>  http://codepositive.com
>  Skills.Networks.Process.Development
>
>  Office: 0207 987 3928
>  Mobile: 07971 478 482
>  Skype: the-greenman
>  twitter: @greenman
>  }}}
>
> --
> Ticket URL: <https://trac.crin.org.archived.website/trac/ticket/51#comment:13>
> CRIN Trac <https://trac.crin.org.archived.website/trac>
> Trac project for CRIN website and servers.
>


--
===============================================================
Code Positive Ltd.                              Drupal +
http://codepositive.com
Skills.Networks.Process.Development

Office: 0207 987 3928
Mobile: 07971 478 482
Skype: the-greenman
twitter: @greenman
comment:16 follow-up: ↓ 17 Changed 3 years ago by peter
We have the php-fpm restart automated.
The processes are locked up because the database is so slow.

The issue is related to caching. There are too many database queries
causing table locks.

Switching to INNODB will improve some of this.

On 9 December 2015 at 13:17, CRIN Trac <trac@trac.crin.org> wrote:

> #51: Number of php5-fpm processes on Crin2
> ------------------------------------+-----------------------------------
>                  Reporter:  chris   |                Owner:  chris
>                      Type:  defect  |               Status:  new
>                  Priority:  major   |            Milestone:  Maintenance
>                 Component:  crin2   |              Version:
>                Resolution:          |             Keywords:
> Estimated Number of Hours:  0       |  Add Hours to Ticket:  0.1
>                 Billable?:  1       |          Total Hours:  0.5
> ------------------------------------+-----------------------------------
> Changes (by chris):
>
>  * hours:  0 => 0.1
>  * totalhours:  0.5 => 0.6
>
>
> Comment:
>
>  Replying to [comment:13 peter]:
>  >
>  > On Monday I tested a change to the search form, but rolled back any of
>  the
>  > updates. Today I have implemented a number of small config changes.
>  >
>  > There seems to be a serious caching issue. Any change on the site seems
>  to
>  > completely break the cache.
>
>  Changes in the PHP / config files should be followed by a `php5-fpm`
>  restart due to the OPCache -- was this done, if not I could do it now.
>
>  Perhaps a memcache restart is also needed, I'm not 100% sure about that.
>
> --
> Ticket URL: <https://trac.crin.org.archived.website/trac/ticket/51#comment:14>
> CRIN Trac <https://trac.crin.org.archived.website/trac>
> Trac project for CRIN website and servers.
>


--
===============================================================
Code Positive Ltd.                              Drupal +
http://codepositive.com
Skills.Networks.Process.Development

Office: 0207 987 3928
Mobile: 07971 478 482
Skype: the-greenman
twitter: @greenman
Changed 3 years ago by chris
comment:17 in reply to: ↑ 16 Changed 3 years ago by chris
- Add Hours to Ticket changed from 0 to 0.8
- Total Hours changed from 0.6 to 1.4
Replying to peter:
We have the php-fpm restart automated.
Strange, I did one just now to see if it would reduce the number of processes:
ps -lA | grep php | wc -l
39
ps -lA | grep php | wc -l
10
And is did for a moment, then it went up in a matter of mins:
ps -lA | grep php | wc -l
20
ps -lA | grep php | wc -l
39
ps -lA | grep php | wc -l
41
And it is at the max again. Trying a memcache restart and then a php5-fpm restart:
service memcached restart
service php5-fpm restart
ps -lA | grep php | wc -l
36
And trying a nginx restart:
ps -lA | grep nginx | wc -l
33
service nginx restart
ps -lA | grep nginx | wc -l
33
ps -lA | grep php | wc -l
41
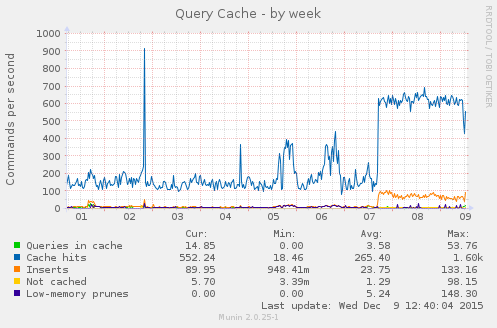
Looking at this memcache graph and considering the increase in mysql traffic, perhaps that needs a restart after php5-fpm is restarted? So I tried that:
service php5-fpm restart
ps -lA | grep php | wc -l
16
ps -lA | grep php | wc -l
41
So this is odd, I don't understand why we now have a lot more php5-fpm processes running compared to a few days ago.
The processes are locked up because the database is so slow.
The issue is related to caching. There are too many database queries
causing table locks.
OK, this is what we have from mysqltuner in Crin1:
 >>  MySQLTuner 1.3.0 - Major Hayden <major@mhtx.net>
 >>  Bug reports, feature requests, and downloads at http://mysqltuner.com/
 >>  Run with '--help' for additional options and output filtering
[OK] Logged in using credentials from debian maintenance account.
[OK] Currently running supported MySQL version 5.5.46-0+deb8u1-log
[OK] Operating on 64-bit architecture

-------- Storage Engine Statistics -------------------------------------------
[--] Status: +ARCHIVE +BLACKHOLE +CSV -FEDERATED +InnoDB +MRG_MYISAM
[--] Data in PERFORMANCE_SCHEMA tables: 0B (Tables: 17)
[--] Data in MEMORY tables: 0B (Tables: 1)
[--] Data in MyISAM tables: 4G (Tables: 317)
[--] Data in InnoDB tables: 4G (Tables: 1666)
[!!] Total fragmented tables: 1725

-------- Security Recommendations  -------------------------------------------
[OK] All database users have passwords assigned

-------- Performance Metrics -------------------------------------------------
[--] Up for: 46d 5h 4m 2s (906M q [227.063 qps], 6M conn, TX: 1539B, RX: 221B)
[--] Reads / Writes: 45% / 55%
[--] Total buffers: 1.5G global + 2.7M per thread (151 max threads)
[OK] Maximum possible memory usage: 1.9G (50% of installed RAM)
[OK] Slow queries: 0% (10K/906M)
[OK] Highest usage of available connections: 51% (78/151)
[OK] Key buffer size / total MyISAM indexes: 16.0M/999.3M
[OK] Key buffer hit rate: 99.9% (58B cached / 34M reads)
[OK] Query cache efficiency: 92.9% (753M cached / 811M selects)
[!!] Query cache prunes per day: 409369
[OK] Sorts requiring temporary tables: 0% (141K temp sorts / 15M sorts)
[OK] Temporary tables created on disk: 5% (582K on disk / 10M total)
[OK] Thread cache hit rate: 99% (39K created / 6M connections)
[!!] Table cache hit rate: 0% (800 open / 771K opened)
[OK] Open file limit used: 19% (345/1K)
[OK] Table locks acquired immediately: 99% (147M immediate / 147M locks)
[!!] InnoDB  buffer pool / data size: 1.0G/4.7G
[OK] InnoDB log waits: 0
-------- Recommendations -----------------------------------------------------
General recommendations:
    Run OPTIMIZE TABLE to defragment tables for better performance
    Increasing the query_cache size over 128M may reduce performance
    Increase table_open_cache gradually to avoid file descriptor limits
    Read this before increasing table_open_cache over 64: http://bit.ly/1mi7c4C
Variables to adjust:
    query_cache_size (> 512M) [see warning above]
    table_open_cache (> 800)
    innodb_buffer_pool_size (>= 4G)
Looking at the this, https://dba.stackexchange.com/a/27341 and the InnoDB data size of 4.7G we have:
mysql> SELECT CEILING(Total_InnoDB_Bytes*1.6/POWER(1024,3)) RIBPS FROM
    -> (SELECT SUM(data_length+index_length) Total_InnoDB_Bytes
    -> FROM information_schema.tables WHERE engine='InnoDB') A;
+-------+
| RIBPS |
+-------+
|    15 |
+-------+
1 row in set (1 min 58.31 sec)
So that suggests a Recommended InnoDB Buffer Pool Size of 15G...
I think we should suggest to CRIN that we get a new server just for the production MySQL database, because looking at the sizes of the databases after they are dumped as plain text:
cd /var/backups/mysql/databases/
du -h --max-depth=1
238M    ./piwik
1.4G    ./stage
2.2G    ./newprod
1.3G    ./drupal
4.0K    ./example
45M     ./mediawiki
1.3M    ./owncloud
72K     ./phpmyadmin
2.1G    ./dev
7.2G    .
The live database is 2.2G, so a dedicated 4G live MySQL server might make all the difference?
Especially since Crin1 is not only running all the MySQL databases but also, Apache, Piwik, ownCloud, Mediawiki, Trac and a Munin server.
Re-reading ticket:50#comment:1 we have 80 myisam tables, and I asked:
I'm not sure which of the above tables can be converted, we are running:
mysql --version
mysql  Ver 14.14 Distrib 5.5.46, for debian-linux-gnu (x86_64) using readline 6.3
InnoDB "doesn't have FULLTEXT search indexes until v5.6"
Do you know which, if any, tables use FULLTEXT search indexes? I haven't found a simple way to find this out -- I think we need to know the answer to this before we convert all the tables to InnoDB?
comment:19 Changed 3 years ago by peter
From the query log:

# Query_time: 331.282870  Lock_time: 0.000063 Rows_sent: 0  Rows_examined:
340260
SET timestamp=1449670821;
SELECT t.word AS realword, i.word FROM search_total t LEFT JOIN
search_index i ON t.word = i.word WHERE i.word IS NULL;


On 9 December 2015 at 13:20, CRIN Trac <trac@trac.crin.org> wrote:

> #51: Number of php5-fpm processes on Crin2
> ------------------------------------+-----------------------------------
>                  Reporter:  chris   |                Owner:  chris
>                      Type:  defect  |               Status:  new
>                  Priority:  major   |            Milestone:  Maintenance
>                 Component:  crin2   |              Version:
>                Resolution:          |             Keywords:
> Estimated Number of Hours:  0       |  Add Hours to Ticket:  0
>                 Billable?:  1       |          Total Hours:  0.6
> ------------------------------------+-----------------------------------
>
> Comment (by peter):
>
>  {{{
>  We have the php-fpm restart automated.
>  The processes are locked up because the database is so slow.
>
>  The issue is related to caching. There are too many database queries
>  causing table locks.
>
>  Switching to INNODB will improve some of this.
>
>  On 9 December 2015 at 13:17, CRIN Trac <trac@trac.crin.org> wrote:
>
>  > #51: Number of php5-fpm processes on Crin2
>  > ------------------------------------+-----------------------------------
>  >                  Reporter:  chris   |                Owner:  chris
>  >                      Type:  defect  |               Status:  new
>  >                  Priority:  major   |            Milestone:  Maintenance
>  >                 Component:  crin2   |              Version:
>  >                Resolution:          |             Keywords:
>  > Estimated Number of Hours:  0       |  Add Hours to Ticket:  0.1
>  >                 Billable?:  1       |          Total Hours:  0.5
>  > ------------------------------------+-----------------------------------
>  > Changes (by chris):
>  >
>  >  * hours:  0 => 0.1
>  >  * totalhours:  0.5 => 0.6
>  >
>  >
>  > Comment:
>  >
>  >  Replying to [comment:13 peter]:
>  >  >
>  >  > On Monday I tested a change to the search form, but rolled back any
>  of
>  >  the
>  >  > updates. Today I have implemented a number of small config changes.
>  >  >
>  >  > There seems to be a serious caching issue. Any change on the site
>  seems
>  >  to
>  >  > completely break the cache.
>  >
>  >  Changes in the PHP / config files should be followed by a `php5-fpm`
>  >  restart due to the OPCache -- was this done, if not I could do it now.
>  >
>  >  Perhaps a memcache restart is also needed, I'm not 100% sure about
>  that.
>  >
>  > --
>  > Ticket URL: <https://trac.crin.org.archived.website/trac/ticket/51#comment:14>
>  > CRIN Trac <https://trac.crin.org.archived.website/trac>
>  > Trac project for CRIN website and servers.
>  >
>
>
>
>  --
>  ===============================================================
>  Code Positive Ltd.                              Drupal +
>  http://codepositive.com
>  Skills.Networks.Process.Development
>
>  Office: 0207 987 3928
>  Mobile: 07971 478 482
>  Skype: the-greenman
>  twitter: @greenman
>  }}}
>
> --
> Ticket URL: <https://trac.crin.org.archived.website/trac/ticket/51#comment:16>
> CRIN Trac <https://trac.crin.org.archived.website/trac>
> Trac project for CRIN website and servers.
>


--
===============================================================
Code Positive Ltd.                              Drupal +
http://codepositive.com
Skills.Networks.Process.Development

Office: 0207 987 3928
Mobile: 07971 478 482
Skype: the-greenman
twitter: @greenman
Changed 3 years ago by chris
comment:21 follow-up: ↓ 22 Changed 3 years ago by peter
The search is going to want to use a fulltext. That is where the main
performance issue is going to be. The search tables however should be the
only ones needing full text. The semaphore and url_alias tables could
benefit from innodb.

I think getting as much ram for INNODB will help us in the short term.


On 9 December 2015 at 14:23, CRIN Trac <trac@trac.crin.org> wrote:

> #51: Number of php5-fpm processes on Crin2
> ------------------------------------+-----------------------------------
>                  Reporter:  chris   |                Owner:  chris
>                      Type:  defect  |               Status:  new
>                  Priority:  major   |            Milestone:  Maintenance
>                 Component:  crin2   |              Version:
>                Resolution:          |             Keywords:
> Estimated Number of Hours:  0       |  Add Hours to Ticket:  0.8
>                 Billable?:  1       |          Total Hours:  0.6
> ------------------------------------+-----------------------------------
> Changes (by chris):
>
>  * hours:  0 => 0.8
>  * totalhours:  0.6 => 1.4
>
>
> Comment:
>
>  Replying to [comment:16 peter]:
>  >
>  > We have the php-fpm restart automated.
>
>  Strange, I did one just now to see if it would reduce the number of
>  processes:
>
>  {{{
>  ps -lA | grep php | wc -l
>  39
>  ps -lA | grep php | wc -l
>  10
>  }}}
>
>  And is did for a moment, then it went up in a matter of mins:
>
>  {{{
>  ps -lA | grep php | wc -l
>  20
>  ps -lA | grep php | wc -l
>  39
>  ps -lA | grep php | wc -l
>  41
>  }}}
>
>  And it is at the max again. Trying a `memcache` restart and then a
>  `php5-fpm` restart:
>
>  {{{
>  service memcached restart
>  service php5-fpm restart
>  ps -lA | grep php | wc -l
>  36
>  }}}
>
>  And trying a `nginx` restart:
>
>  {{{
>  ps -lA | grep nginx | wc -l
>  33
>  service nginx restart
>  ps -lA | grep nginx | wc -l
>  33
>  ps -lA | grep php | wc -l
>  41
>  }}}
>
>  Looking at this `memcache` graph and considering the increase in `mysql`
>  traffic, perhaps that needs a restart after `php5-fpm` is restarted? So I
>  tried that:
>
>  {{{
>  service php5-fpm restart
>  ps -lA | grep php | wc -l
>  16
>  ps -lA | grep php | wc -l
>  41
>  }}}
>
>  So this is odd, I don't understand why we now have a lot more `php5-fpm`
>  processes running compared to a few days ago.
>
>  > The processes are locked up because the database is so slow.
>  >
>  > The issue is related to caching. There are too many database queries
>  > causing table locks.
>
>  OK, this is what we have from `mysqltuner` in [[Crin1]]:
>
>  {{{
>   >>  MySQLTuner 1.3.0 - Major Hayden <major@mhtx.net>
>   >>  Bug reports, feature requests, and downloads at
>  http://mysqltuner.com/
>   >>  Run with '--help' for additional options and output filtering
>  [OK] Logged in using credentials from debian maintenance account.
>  [OK] Currently running supported MySQL version 5.5.46-0+deb8u1-log
>  [OK] Operating on 64-bit architecture
>
>  -------- Storage Engine Statistics
>  -------------------------------------------
>  [--] Status: +ARCHIVE +BLACKHOLE +CSV -FEDERATED +InnoDB +MRG_MYISAM
>  [--] Data in PERFORMANCE_SCHEMA tables: 0B (Tables: 17)
>  [--] Data in MEMORY tables: 0B (Tables: 1)
>  [--] Data in MyISAM tables: 4G (Tables: 317)
>  [--] Data in InnoDB tables: 4G (Tables: 1666)
>  [!!] Total fragmented tables: 1725
>
>  -------- Security Recommendations
>  -------------------------------------------
>  [OK] All database users have passwords assigned
>
>  -------- Performance Metrics
>  -------------------------------------------------
>  [--] Up for: 46d 5h 4m 2s (906M q [227.063 qps], 6M conn, TX: 1539B, RX:
>  221B)
>  [--] Reads / Writes: 45% / 55%
>  [--] Total buffers: 1.5G global + 2.7M per thread (151 max threads)
>  [OK] Maximum possible memory usage: 1.9G (50% of installed RAM)
>  [OK] Slow queries: 0% (10K/906M)
>  [OK] Highest usage of available connections: 51% (78/151)
>  [OK] Key buffer size / total MyISAM indexes: 16.0M/999.3M
>  [OK] Key buffer hit rate: 99.9% (58B cached / 34M reads)
>  [OK] Query cache efficiency: 92.9% (753M cached / 811M selects)
>  [!!] Query cache prunes per day: 409369
>  [OK] Sorts requiring temporary tables: 0% (141K temp sorts / 15M sorts)
>  [OK] Temporary tables created on disk: 5% (582K on disk / 10M total)
>  [OK] Thread cache hit rate: 99% (39K created / 6M connections)
>  [!!] Table cache hit rate: 0% (800 open / 771K opened)
>  [OK] Open file limit used: 19% (345/1K)
>  [OK] Table locks acquired immediately: 99% (147M immediate / 147M locks)
>  [!!] InnoDB  buffer pool / data size: 1.0G/4.7G
>  [OK] InnoDB log waits: 0
>  -------- Recommendations
>  -----------------------------------------------------
>  General recommendations:
>      Run OPTIMIZE TABLE to defragment tables for better performance
>      Increasing the query_cache size over 128M may reduce performance
>      Increase table_open_cache gradually to avoid file descriptor limits
>      Read this before increasing table_open_cache over 64:
>  http://bit.ly/1mi7c4C
>  Variables to adjust:
>      query_cache_size (> 512M) [see warning above]
>      table_open_cache (> 800)
>      innodb_buffer_pool_size (>= 4G)
>  }}}
>
>  Looking at the  this, https://dba.stackexchange.com/a/27341 and the
> InnoDB
>  data size of 4.7G we have:
>
>  {{{
>  mysql> SELECT CEILING(Total_InnoDB_Bytes*1.6/POWER(1024,3)) RIBPS FROM
>      -> (SELECT SUM(data_length+index_length) Total_InnoDB_Bytes
>      -> FROM information_schema.tables WHERE engine='InnoDB') A;
>  +-------+
>  | RIBPS |
>  +-------+
>  |    15 |
>  +-------+
>  1 row in set (1 min 58.31 sec)
>  }}}
>
>  So that suggests a Recommended InnoDB Buffer Pool Size of 15G...
>
>  I think we should suggest to CRIN that we get a new server just for the
>  production MySQL database, because looking at the sizes of the databases
>  after they are dumped as plain text:
>
>  {{{
>  cd /var/backups/mysql/databases/
>  du -h --max-depth=1
>  238M    ./piwik
>  1.4G    ./stage
>  2.2G    ./newprod
>  1.3G    ./drupal
>  4.0K    ./example
>  45M     ./mediawiki
>  1.3M    ./owncloud
>  72K     ./phpmyadmin
>  2.1G    ./dev
>  7.2G    .
>  }}}
>
>  The live database is 2.2G, so a dedicated 4G live MySQL server might make
>  all the difference?
>
>  Especially since [[Crin1]] is not only running all the MySQL databases but
>  also, Apache, Piwik, ownCloud, Mediawiki, Trac and a Munin server.
>
>  Re-reading ticket:50#comment:1 we have 80 `myisam` tables, and I asked:
>
>  > I'm not sure which of the above tables can be converted, we are running:
>  > {{{
>  > mysql --version
>  > mysql  Ver 14.14 Distrib 5.5.46, for debian-linux-gnu (x86_64) using
>  readline 6.3
>  > }}}
>  > InnoDB "doesn't have FULLTEXT search indexes until v5.6"
>
>  Do you know which, if any, tables use FULLTEXT search indexes? I haven't
>  found a simple way to find this out -- I think we need to know the answer
>  to this before we convert all the tables to InnoDB?
>
> --
> Ticket URL: <https://trac.crin.org.archived.website/trac/ticket/51#comment:17>
> CRIN Trac <https://trac.crin.org.archived.website/trac>
> Trac project for CRIN website and servers.
>


--
===============================================================
Code Positive Ltd.                              Drupal +
http://codepositive.com
Skills.Networks.Process.Development

Office: 0207 987 3928
Mobile: 07971 478 482
Skype: the-greenman
twitter: @greenman
Changed 3 years ago by chris
comment:22 in reply to: ↑ 21 Changed 3 years ago by chris
- Add Hours to Ticket changed from 0 to 0.25
- Total Hours changed from 1.4 to 1.65
Replying to peter:
The search is going to want to use a fulltext. That is where the main
performance issue is going to be. The search tables however should be the
only ones needing full text. The semaphore and url_alias tables could
benefit from innodb.
OK, are these the only 4 search tables?
newprod search_dataset
newprod search_index
newprod search_node_links
newprod search_total
I think getting as much ram for INNODB will help us in the short term.
Agreed, it should also help with the disk speed issue, I think this is related to this:
Do you agree that a new virtual server with 4GB of RAM dedicated to running MySQL for the live site is the way forward for this? And if so would you like to raise this with Crin or should I?
comment:23 Changed 3 years ago by chris
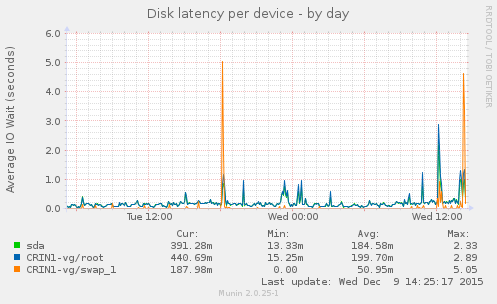
It is also worth noting the the email alerts Munin sends out have even higer values than the graphs for things like iowait, for example:
Date: Wed, 09 Dec 2015 14:36:50 +0000
From: munin application user <munin@crin1.crin.org>
To: root@localhost
Subject: crin1.crin.org Munin Alert

crin.org :: crin1.crin.org :: Disk latency per device :: Average latency for /dev/sda
        WARNINGs: Write IO Wait time is 10.77 (outside range [0:3]).
        OKs: Read IO Wait time is 0.06.

crin.org :: crin1.crin.org :: Disk latency per device :: Average latency for /dev/CRIN1-vg/swap_1
        WARNINGs: Write IO Wait time is 9.02 (outside range [0:3]).
        OKs: Read IO Wait time is 0.26.

crin.org :: crin1.crin.org :: Disk latency per device :: Average latency for /dev/CRIN1-vg/root
        WARNINGs: Write IO Wait time is 8.69 (outside range [0:3]).
        OKs: Read IO Wait time is 0.06.
comment:24 Changed 3 years ago by chris
And an even worse one:
Date: Wed, 09 Dec 2015 14:40:56 +0000
From: munin application user <munin@crin1.crin.org>
To: root@localhost
Subject: crin1.crin.org Munin Alert

crin.org :: crin1.crin.org :: Disk latency per device :: Average latency for /dev/CRIN1-vg/root
        WARNINGs: Write IO Wait time is 8.16 (outside range [0:3]).
        OKs: Read IO Wait time is 0.07.

crin.org :: crin1.crin.org :: Disk latency per device :: Average latency for /dev/sda
        WARNINGs: Write IO Wait time is 9.88 (outside range [0:3]).
        OKs: Read IO Wait time is 0.06.

crin.org :: crin1.crin.org :: Disk latency per device :: Average latency for /dev/CRIN1-vg/swap_1
        WARNINGs: Write IO Wait time is 26.10 (outside range [0:3]).
        OKs: Read IO Wait time is 0.10.
comment:26 follow-up: ↓ 27 Changed 3 years ago by peter
Is there any way we can increase the memory available to INNODB on the
current server?
The switch will not be happening soon

On 9 December 2015 at 14:42, CRIN Trac <trac@trac.crin.org> wrote:

> #51: Number of php5-fpm processes on Crin2
> ------------------------------------+-----------------------------------
>                  Reporter:  chris   |                Owner:  chris
>                      Type:  defect  |               Status:  new
>                  Priority:  major   |            Milestone:  Maintenance
>                 Component:  crin2   |              Version:
>                Resolution:          |             Keywords:
> Estimated Number of Hours:  0       |  Add Hours to Ticket:  0
>                 Billable?:  1       |          Total Hours:  1.65
> ------------------------------------+-----------------------------------
>
> Comment (by chris):
>
>  And an even worse one:
>
>  {{{
>  Date: Wed, 09 Dec 2015 14:40:56 +0000
>  From: munin application user <munin@crin1.crin.org>
>  To: root@localhost
>  Subject: crin1.crin.org Munin Alert
>
>  crin.org :: crin1.crin.org :: Disk latency per device :: Average latency
>  for /dev/CRIN1-vg/root
>          WARNINGs: Write IO Wait time is 8.16 (outside range [0:3]).
>          OKs: Read IO Wait time is 0.07.
>
>  crin.org :: crin1.crin.org :: Disk latency per device :: Average latency
>  for /dev/sda
>          WARNINGs: Write IO Wait time is 9.88 (outside range [0:3]).
>          OKs: Read IO Wait time is 0.06.
>
>  crin.org :: crin1.crin.org :: Disk latency per device :: Average latency
>  for /dev/CRIN1-vg/swap_1
>          WARNINGs: Write IO Wait time is 26.10 (outside range [0:3]).
>          OKs: Read IO Wait time is 0.10.
>  }}}
>
> --
> Ticket URL: <https://trac.crin.org.archived.website/trac/ticket/51#comment:24>
> CRIN Trac <https://trac.crin.org.archived.website/trac>
> Trac project for CRIN website and servers.
>


--
===============================================================
Code Positive Ltd.                              Drupal +
http://codepositive.com
Skills.Networks.Process.Development

Office: 0207 987 3928
Mobile: 07971 478 482
Skype: the-greenman
twitter: @greenman
comment:27 in reply to: ↑ 26 Changed 3 years ago by chris
- Add Hours to Ticket changed from 0 to 0.4
- Total Hours changed from 1.65 to 2.05
Replying to peter:
Is there any way we can increase the memory available to INNODB on the
current server?
Yes but I would expect it to have some impact on the other services running on the server. I'll increase it now from 1024M to 2048M and see how that goes.
This is the result of mysqltuner before the change:
 >>  MySQLTuner 1.3.0 - Major Hayden <major@mhtx.net>
 >>  Bug reports, feature requests, and downloads at http://mysqltuner.com/
 >>  Run with '--help' for additional options and output filtering
[OK] Logged in using credentials from debian maintenance account.
[OK] Currently running supported MySQL version 5.5.46-0+deb8u1-log
[OK] Operating on 64-bit architecture

-------- Storage Engine Statistics -------------------------------------------
[--] Status: +ARCHIVE +BLACKHOLE +CSV -FEDERATED +InnoDB +MRG_MYISAM
[--] Data in PERFORMANCE_SCHEMA tables: 0B (Tables: 17)
[--] Data in MyISAM tables: 4G (Tables: 317)
[--] Data in MEMORY tables: 0B (Tables: 1)
[--] Data in InnoDB tables: 4G (Tables: 1666)
[!!] Total fragmented tables: 1727

-------- Security Recommendations  -------------------------------------------
[OK] All database users have passwords assigned

-------- Performance Metrics -------------------------------------------------
[--] Up for: 23h 56m 19s (81M q [944.564 qps], 103K conn, TX: 100B, RX: 18B)
[--] Reads / Writes: 20% / 80%
[--] Total buffers: 1.5G global + 2.7M per thread (151 max threads)
[OK] Maximum possible memory usage: 1.9G (50% of installed RAM)
[OK] Slow queries: 0% (617/81M)
[OK] Highest usage of available connections: 79% (120/151)
[OK] Key buffer size / total MyISAM indexes: 16.0M/1000.1M
[OK] Key buffer hit rate: 99.9% (1B cached / 1M reads)
[OK] Query cache efficiency: 89.4% (51M cached / 57M selects)
[!!] Query cache prunes per day: 262298
[OK] Sorts requiring temporary tables: 0% (2K temp sorts / 826K sorts)
[OK] Temporary tables created on disk: 8% (11K on disk / 127K total)
[OK] Thread cache hit rate: 94% (5K created / 103K connections)
[!!] Table cache hit rate: 4% (800 open / 18K opened)
[OK] Open file limit used: 16% (296/1K)
[OK] Table locks acquired immediately: 99% (30M immediate / 30M locks)
[!!] InnoDB  buffer pool / data size: 1.0G/4.7G
[OK] InnoDB log waits: 0
-------- Recommendations -----------------------------------------------------
General recommendations:
    Run OPTIMIZE TABLE to defragment tables for better performance
    MySQL started within last 24 hours - recommendations may be inaccurate
    Increasing the query_cache size over 128M may reduce performance
    Increase table_open_cache gradually to avoid file descriptor limits
    Read this before increasing table_open_cache over 64: http://bit.ly/1mi7c4C
Variables to adjust:
    query_cache_size (> 512M) [see warning above]
    table_open_cache (> 800)
    innodb_buffer_pool_size (>= 4G)
The switch will not be happening soon
What do you mean by "the switch", do you mean CRIN are not able to fund a dedicated MySQL server for the live site?
I asked yesterday:
are these the only 4 search tables?
newprod search_dataset
newprod search_index
newprod search_node_links
newprod search_total
If you can confirm that I can switch all the other database tables to InnoDB, however given that we don't have as much RAM as InnoDB data I don't know what performance increase can be expected from that.
comment:28 follow-up: ↓ 29 Changed 3 years ago by peter
> What do you mean by "the switch", do you mean CRIN are not able to fund a
 dedicated MySQL server for the live site?

I think the work involved in switching to a different server will take some
time and planning. So, it is possible, but would be something probably only
worth considering in the new year.


>are these the only 4 search tables?
 > {{{
 > newprod search_dataset
 > newprod search_index
 > newprod search_node_links
 > newprod search_total
 > }}}


They are the key search tables. I suspect that these may be involved too:

+-------------------------------------------------------------+
| Tables_in_drupal (search%)                                  |
+-------------------------------------------------------------+
| search_api_db_customsearch                                  |
| search_api_db_customsearch_body_summary                     |
| search_api_db_customsearch_body_value                       |
| search_api_db_customsearch_field_address                    |
| search_api_db_customsearch_field_age_group                  |
| search_api_db_customsearch_field_author                     |
| search_api_db_customsearch_field_author_org                 |
| search_api_db_customsearch_field_cited_crcs                 |
| search_api_db_customsearch_field_country                    |
| search_api_db_customsearch_field_crc                        |
| search_api_db_customsearch_field_email                      |
| search_api_db_customsearch_field_event_info                 |
| search_api_db_customsearch_field_event_type                 |
| search_api_db_customsearch_field_fax                        |
| search_api_db_customsearch_field_general_measures           |
| search_api_db_customsearch_field_general_related_items      |
| search_api_db_customsearch_field_highlights                 |
| search_api_db_customsearch_field_instruments                |
| search_api_db_customsearch_field_intruments                 |
| search_api_db_customsearch_field_issues                     |
| search_api_db_customsearch_field_legal_item                 |
| search_api_db_customsearch_field_mandate                    |
| search_api_db_customsearch_field_monitoring_body            |
| search_api_db_customsearch_field_news                       |
| search_api_db_customsearch_field_organisation               |
| search_api_db_customsearch_field_organisation_typr          |
| search_api_db_customsearch_field_persistent_violations      |
| search_api_db_customsearch_field_publications               |
| search_api_db_customsearch_field_quick_links                |
| search_api_db_customsearch_field_regions                    |
| search_api_db_customsearch_field_related_campaign           |
| search_api_db_customsearch_field_related_crc                |
| search_api_db_customsearch_field_report                     |
| search_api_db_customsearch_field_scope                      |
| search_api_db_customsearch_field_special_campaign_sub_pages |
| search_api_db_customsearch_field_subtitle                   |
| search_api_db_customsearch_field_tags                       |
| search_api_db_customsearch_field_tel                        |
| search_api_db_customsearch_field_themes                     |
| search_api_db_customsearch_field_treaty                     |
| search_api_db_customsearch_field_violence                   |
| search_api_db_customsearch_field_violence_settings          |
| search_api_db_customsearch_field_web                        |
| search_api_db_customsearch_search_api_access_node           |
| search_api_db_customsearch_title                            |
| search_api_index                                            |
| search_api_item                                             |
| search_api_server                                           |
| search_dataset                                              |
| search_index                                                |
| search_node_links                                           |
| search_total                                                |
comment:29 in reply to: ↑ 28 Changed 3 years ago by chris
- Add Hours to Ticket changed from 0 to 0.6
- Total Hours changed from 2.05 to 2.65
Replying to peter:
I think the work involved in switching to a different server will take some
time and planning. So, it is possible, but would be something probably only
worth considering in the new year.
OK, let me know, it isn't a huge amount of work from my point of view, I'd expect it to take a day to get up and running. But I also appreciate that it would need your deployment scripts to be updated.
They are the key search tables. I suspect that these may be involved too:
+-------------------------------------------------------------+
| Tables_in_drupal (search%) |
+-------------------------------------------------------------+
| search_api_db_customsearch |
| search_api_db_customsearch_body_summary |
| search_api_db_customsearch_body_value |
| search_api_db_customsearch_field_address |
| search_api_db_customsearch_field_age_group |
| search_api_db_customsearch_field_author |
| search_api_db_customsearch_field_author_org |
| search_api_db_customsearch_field_cited_crcs |
| search_api_db_customsearch_field_country |
| search_api_db_customsearch_field_crc |
| search_api_db_customsearch_field_email |
| search_api_db_customsearch_field_event_info |
| search_api_db_customsearch_field_event_type |
| search_api_db_customsearch_field_fax |
| search_api_db_customsearch_field_general_measures |
| search_api_db_customsearch_field_general_related_items |
| search_api_db_customsearch_field_highlights |
| search_api_db_customsearch_field_instruments |
| search_api_db_customsearch_field_intruments |
| search_api_db_customsearch_field_issues |
| search_api_db_customsearch_field_legal_item |
| search_api_db_customsearch_field_mandate |
| search_api_db_customsearch_field_monitoring_body |
| search_api_db_customsearch_field_news |
| search_api_db_customsearch_field_organisation |
| search_api_db_customsearch_field_organisation_typr |
| search_api_db_customsearch_field_persistent_violations |
| search_api_db_customsearch_field_publications |
| search_api_db_customsearch_field_quick_links |
| search_api_db_customsearch_field_regions |
| search_api_db_customsearch_field_related_campaign |
| search_api_db_customsearch_field_related_crc |
| search_api_db_customsearch_field_report |
| search_api_db_customsearch_field_scope |
| search_api_db_customsearch_field_special_campaign_sub_pages |
| search_api_db_customsearch_field_subtitle |
| search_api_db_customsearch_field_tags |
| search_api_db_customsearch_field_tel |
| search_api_db_customsearch_field_themes |
| search_api_db_customsearch_field_treaty |
| search_api_db_customsearch_field_violence |
| search_api_db_customsearch_field_violence_settings |
| search_api_db_customsearch_field_web |
| search_api_db_customsearch_search_api_access_node |
| search_api_db_customsearch_title |
| search_api_index |
| search_api_item |
| search_api_server |
The above are all InnoDB already, see the full list on ticket:50#comment:1.
Getting a list of tables to convert:
echo "SELECT table_schema, table_name FROM INFORMATION_SCHEMA.TABLES WHERE engine = 'myisam';" | mysql | grep newprod | grep -v search
And turning that list into SQL we have:
ALTER TABLE     actions ENGINE=InnoDB;
ALTER TABLE     authmap ENGINE=InnoDB;
ALTER TABLE     backup_migrate_destinations ENGINE=InnoDB;
ALTER TABLE     backup_migrate_profiles ENGINE=InnoDB;
ALTER TABLE     backup_migrate_schedules ENGINE=InnoDB;
ALTER TABLE     batch ENGINE=InnoDB;
ALTER TABLE     block ENGINE=InnoDB;
ALTER TABLE     block_custom ENGINE=InnoDB;
ALTER TABLE     block_node_type ENGINE=InnoDB;
ALTER TABLE     block_role ENGINE=InnoDB;
ALTER TABLE     blocked_ips ENGINE=InnoDB;
ALTER TABLE     cache ENGINE=InnoDB;
ALTER TABLE     cache_block ENGINE=InnoDB;
ALTER TABLE     cache_bootstrap ENGINE=InnoDB;
ALTER TABLE     cache_field ENGINE=InnoDB;
ALTER TABLE     cache_filter ENGINE=InnoDB;
ALTER TABLE     cache_form ENGINE=InnoDB;
ALTER TABLE     cache_image ENGINE=InnoDB;
ALTER TABLE     cache_menu ENGINE=InnoDB;
ALTER TABLE     cache_page ENGINE=InnoDB;
ALTER TABLE     cache_path ENGINE=InnoDB;
ALTER TABLE     cache_views ENGINE=InnoDB;
ALTER TABLE     cache_views_data ENGINE=InnoDB;
ALTER TABLE     ckeditor_input_format ENGINE=InnoDB;
ALTER TABLE     ckeditor_settings ENGINE=InnoDB;
ALTER TABLE     ctools_css_cache ENGINE=InnoDB;
ALTER TABLE     ctools_object_cache ENGINE=InnoDB;
ALTER TABLE     date_format_locale ENGINE=InnoDB;
ALTER TABLE     date_format_type ENGINE=InnoDB;
ALTER TABLE     date_formats ENGINE=InnoDB;
ALTER TABLE     field_config ENGINE=InnoDB;
ALTER TABLE     field_config_instance ENGINE=InnoDB;
ALTER TABLE     field_data_body ENGINE=InnoDB;
ALTER TABLE     field_data_og_membership_request ENGINE=InnoDB;
ALTER TABLE     field_revision_body ENGINE=InnoDB;
ALTER TABLE     field_revision_og_membership_request ENGINE=InnoDB;
ALTER TABLE     file_managed ENGINE=InnoDB;
ALTER TABLE     file_usage ENGINE=InnoDB;
ALTER TABLE     filter ENGINE=InnoDB;
ALTER TABLE     filter_format ENGINE=InnoDB;
ALTER TABLE     flood ENGINE=InnoDB;
ALTER TABLE     history ENGINE=InnoDB;
ALTER TABLE     image_effects ENGINE=InnoDB;
ALTER TABLE     image_styles ENGINE=InnoDB;
ALTER TABLE     menu_custom ENGINE=InnoDB;
ALTER TABLE     menu_links ENGINE=InnoDB;
ALTER TABLE     menu_router ENGINE=InnoDB;
ALTER TABLE     node ENGINE=InnoDB;
ALTER TABLE     node_access ENGINE=InnoDB;
ALTER TABLE     node_revision ENGINE=InnoDB;
ALTER TABLE     node_type ENGINE=InnoDB;
ALTER TABLE     queue ENGINE=InnoDB;
ALTER TABLE     rdf_mapping ENGINE=InnoDB;
ALTER TABLE     registry ENGINE=InnoDB;
ALTER TABLE     registry_bak ENGINE=InnoDB;
ALTER TABLE     registry_file ENGINE=InnoDB;
ALTER TABLE     role ENGINE=InnoDB;
ALTER TABLE     role_permission ENGINE=InnoDB;
ALTER TABLE     semaphore ENGINE=InnoDB;
ALTER TABLE     sequences ENGINE=InnoDB;
ALTER TABLE     sessions ENGINE=InnoDB;
ALTER TABLE     shortcut_set ENGINE=InnoDB;
ALTER TABLE     shortcut_set_users ENGINE=InnoDB;
ALTER TABLE     system ENGINE=InnoDB;
ALTER TABLE     system_bak ENGINE=InnoDB;
ALTER TABLE     taxonomy_index ENGINE=InnoDB;
ALTER TABLE     taxonomy_term_data ENGINE=InnoDB;
ALTER TABLE     taxonomy_term_hierarchy ENGINE=InnoDB;
ALTER TABLE     taxonomy_vocabulary ENGINE=InnoDB;
ALTER TABLE     trigger_assignments ENGINE=InnoDB;
ALTER TABLE     url_alias ENGINE=InnoDB;
ALTER TABLE     users ENGINE=InnoDB;
ALTER TABLE     users_roles ENGINE=InnoDB;
ALTER TABLE     variable ENGINE=InnoDB;
ALTER TABLE     views_display ENGINE=InnoDB;
ALTER TABLE     views_view ENGINE=InnoDB;
So the above SQl was run on the newprod database:
mysql> use newprod;
Reading table information for completion of table and column names
You can turn off this feature to get a quicker startup with -A

Database changed
mysql> ALTER TABLE     actions ENGINE=InnoDB;
Query OK, 17 rows affected (0.35 sec)
Records: 17  Duplicates: 0  Warnings: 0

mysql> ALTER TABLE     authmap ENGINE=InnoDB;
Query OK, 0 rows affected (0.27 sec)
Records: 0  Duplicates: 0  Warnings: 0

mysql> ALTER TABLE     backup_migrate_destinations ENGINE=InnoDB;
Query OK, 1 row affected (0.14 sec)
Records: 1  Duplicates: 0  Warnings: 0

mysql> ALTER TABLE     backup_migrate_profiles ENGINE=InnoDB;
Query OK, 1 row affected (0.06 sec)
Records: 1  Duplicates: 0  Warnings: 0

mysql> ALTER TABLE     backup_migrate_schedules ENGINE=InnoDB;
Query OK, 2 rows affected (0.15 sec)
Records: 2  Duplicates: 0  Warnings: 0

mysql> ALTER TABLE     batch ENGINE=InnoDB;
Query OK, 0 rows affected (0.04 sec)
Records: 0  Duplicates: 0  Warnings: 0

mysql> ALTER TABLE     block ENGINE=InnoDB;
Query OK, 732 rows affected (0.24 sec)
Records: 732  Duplicates: 0  Warnings: 0

mysql> ALTER TABLE     block_custom ENGINE=InnoDB;
Query OK, 14 rows affected (0.02 sec)
Records: 14  Duplicates: 0  Warnings: 0

mysql> ALTER TABLE     block_node_type ENGINE=InnoDB;
Query OK, 67 rows affected (0.02 sec)
Records: 67  Duplicates: 0  Warnings: 0

mysql> ALTER TABLE     block_role ENGINE=InnoDB;
Query OK, 10 rows affected (0.12 sec)
Records: 10  Duplicates: 0  Warnings: 0

mysql> ALTER TABLE     blocked_ips ENGINE=InnoDB;
Query OK, 0 rows affected (0.04 sec)
Records: 0  Duplicates: 0  Warnings: 0

mysql> ALTER TABLE     cache ENGINE=InnoDB;
Query OK, 69 rows affected (1.74 sec)
Records: 69  Duplicates: 0  Warnings: 0

mysql> ALTER TABLE     cache_block ENGINE=InnoDB;
Query OK, 0 rows affected (0.02 sec)
Records: 0  Duplicates: 0  Warnings: 0

mysql> ALTER TABLE     cache_bootstrap ENGINE=InnoDB;
Query OK, 11 rows affected (0.54 sec)
Records: 11  Duplicates: 0  Warnings: 0

mysql> ALTER TABLE     cache_field ENGINE=InnoDB;
Query OK, 533 rows affected (0.34 sec)
Records: 533  Duplicates: 0  Warnings: 0

mysql> ALTER TABLE     cache_filter ENGINE=InnoDB;
Query OK, 3 rows affected (0.14 sec)
Records: 3  Duplicates: 0  Warnings: 0


mysql> ALTER TABLE     cache_form ENGINE=InnoDB;
Query OK, 52 rows affected (3.98 sec)
Records: 52  Duplicates: 0  Warnings: 0

mysql> ALTER TABLE     cache_image ENGINE=InnoDB;
Query OK, 0 rows affected (0.02 sec)
Records: 0  Duplicates: 0  Warnings: 0

mysql> ALTER TABLE     cache_menu ENGINE=InnoDB;
Query OK, 205448 rows affected (5 min 6.54 sec)
Records: 205448  Duplicates: 0  Warnings: 0

mysql> ALTER TABLE     cache_page ENGINE=InnoDB;
Query OK, 4151 rows affected (34.68 sec)
Records: 4151  Duplicates: 0  Warnings: 0

mysql> ALTER TABLE     cache_path ENGINE=InnoDB;
Query OK, 13203 rows affected (16.05 sec)
Records: 13203  Duplicates: 0  Warnings: 0

mysql> ALTER TABLE     cache_views ENGINE=InnoDB;
Query OK, 16 rows affected (0.44 sec)
Records: 16  Duplicates: 0  Warnings: 0

mysql> ALTER TABLE     cache_views_data ENGINE=InnoDB;
Query OK, 0 rows affected (0.01 sec)
Records: 0  Duplicates: 0  Warnings: 0

mysql> ALTER TABLE     ckeditor_input_format ENGINE=InnoDB;
Query OK, 2 rows affected (0.04 sec)
Records: 2  Duplicates: 0  Warnings: 0

mysql> ALTER TABLE     ckeditor_settings ENGINE=InnoDB;
Query OK, 2 rows affected (0.15 sec)
Records: 2  Duplicates: 0  Warnings: 0

mysql> ALTER TABLE     ctools_css_cache ENGINE=InnoDB;
Query OK, 0 rows affected (0.01 sec)
Records: 0  Duplicates: 0  Warnings: 0

mysql> ALTER TABLE     ctools_object_cache ENGINE=InnoDB;
Query OK, 0 rows affected (0.04 sec)
Records: 0  Duplicates: 0  Warnings: 0

mysql> ALTER TABLE     date_format_locale ENGINE=InnoDB;
Query OK, 0 rows affected (0.12 sec)
Records: 0  Duplicates: 0  Warnings: 0

mysql> ALTER TABLE     date_format_type ENGINE=InnoDB;
Query OK, 5 rows affected (0.03 sec)
Records: 5  Duplicates: 0  Warnings: 0

mysql> ALTER TABLE     date_formats ENGINE=InnoDB;
Query OK, 38 rows affected (0.03 sec)
Records: 38  Duplicates: 0  Warnings: 0

mysql> ALTER TABLE     field_config ENGINE=InnoDB;
Query OK, 123 rows affected (0.55 sec)
Records: 123  Duplicates: 0  Warnings: 0

mysql> ALTER TABLE     field_config_instance ENGINE=InnoDB;
Query OK, 376 rows affected (0.70 sec)
Records: 376  Duplicates: 0  Warnings: 0

mysql> ALTER TABLE     field_data_body ENGINE=InnoDB;
Query OK, 40083 rows affected (2 min 49.56 sec)
Records: 40083  Duplicates: 0  Warnings: 0

mysql> ALTER TABLE     field_data_og_membership_request ENGINE=InnoDB;
Query OK, 1 row affected (0.51 sec)
Records: 1  Duplicates: 0  Warnings: 0

mysql> ALTER TABLE     field_revision_body ENGINE=InnoDB;

Query OK, 40084 rows affected (2 min 21.78 sec)
Records: 40084  Duplicates: 0  Warnings: 0

mysql> ALTER TABLE     field_revision_og_membership_request ENGINE=InnoDB;
Query OK, 1 row affected (0.28 sec)
Records: 1  Duplicates: 0  Warnings: 0

mysql> ALTER TABLE     file_managed ENGINE=InnoDB;
Query OK, 2673 rows affected (0.41 sec)
Records: 2673  Duplicates: 0  Warnings: 0

mysql> ALTER TABLE     file_usage ENGINE=InnoDB;
Query OK, 3055 rows affected (0.56 sec)
Records: 3055  Duplicates: 0  Warnings: 0

mysql> ALTER TABLE     filter ENGINE=InnoDB;
Query OK, 43 rows affected (0.06 sec)
Records: 43  Duplicates: 0  Warnings: 0

mysql> ALTER TABLE     filter_format ENGINE=InnoDB;
Query OK, 5 rows affected (0.64 sec)
Records: 5  Duplicates: 0  Warnings: 0

mysql> ALTER TABLE     flood ENGINE=InnoDB;
Query OK, 16 rows affected (1.96 sec)
Records: 16  Duplicates: 0  Warnings: 0

mysql> ALTER TABLE     history ENGINE=InnoDB;
Query OK, 1072 rows affected (0.89 sec)
Records: 1072  Duplicates: 0  Warnings: 0

mysql> ALTER TABLE     image_effects ENGINE=InnoDB;
Query OK, 14 rows affected (0.48 sec)
Records: 14  Duplicates: 0  Warnings: 0

mysql> ALTER TABLE     image_styles ENGINE=InnoDB;
Query OK, 14 rows affected (0.03 sec)
Records: 14  Duplicates: 0  Warnings: 0

mysql> ALTER TABLE     menu_custom ENGINE=InnoDB;
Query OK, 13 rows affected (0.02 sec)
Records: 13  Duplicates: 0  Warnings: 0

mysql> ALTER TABLE     menu_links ENGINE=InnoDB;
Query OK, 2032 rows affected (1.01 sec)
Records: 2032  Duplicates: 0  Warnings: 0

mysql> ALTER TABLE     menu_router ENGINE=InnoDB;
Query OK, 979 rows affected (0.09 sec)
Records: 979  Duplicates: 0  Warnings: 0

mysql> ALTER TABLE     node ENGINE=InnoDB;
Query OK, 41660 rows affected (9.00 sec)
Records: 41660  Duplicates: 0  Warnings: 0

mysql> ALTER TABLE     node_access ENGINE=InnoDB;
Query OK, 81241 rows affected (5.01 sec)
Records: 81241  Duplicates: 0  Warnings: 0

mysql> ALTER TABLE     node_revision ENGINE=InnoDB;
Query OK, 41662 rows affected (3.16 sec)
Records: 41662  Duplicates: 0  Warnings: 0

mysql> ALTER TABLE     node_type ENGINE=InnoDB;
Query OK, 24 rows affected (0.05 sec)
Records: 24  Duplicates: 0  Warnings: 0

mysql> ALTER TABLE     queue ENGINE=InnoDB;
Query OK, 1 row affected (0.04 sec)
Records: 1  Duplicates: 0  Warnings: 0

mysql> ALTER TABLE     rdf_mapping ENGINE=InnoDB;
Query OK, 2 rows affected (0.07 sec)
Records: 2  Duplicates: 0  Warnings: 0

mysql> ALTER TABLE     registry ENGINE=InnoDB;
Query OK, 1333 rows affected (0.63 sec)
Records: 1333  Duplicates: 0  Warnings: 0

mysql> ALTER TABLE     registry_bak ENGINE=InnoDB;
Query OK, 1353 rows affected (0.14 sec)
Records: 1353  Duplicates: 0  Warnings: 0

mysql> ALTER TABLE     registry_file ENGINE=InnoDB;
Query OK, 785 rows affected (0.25 sec)
Records: 785  Duplicates: 0  Warnings: 0

mysql> ALTER TABLE     role ENGINE=InnoDB;
Query OK, 6 rows affected (1.14 sec)
Records: 6  Duplicates: 0  Warnings: 0

mysql> ALTER TABLE     role_permission ENGINE=InnoDB;
Query OK, 510 rows affected (0.33 sec)
Records: 510  Duplicates: 0  Warnings: 0

mysql> ALTER TABLE     semaphore ENGINE=InnoDB;
Query OK, 2 rows affected (0.03 sec)
Records: 2  Duplicates: 0  Warnings: 0

mysql> ALTER TABLE     sequences ENGINE=InnoDB;
Query OK, 1 row affected (0.03 sec)
Records: 1  Duplicates: 0  Warnings: 0

mysql> ALTER TABLE     sessions ENGINE=InnoDB;
Query OK, 22673 rows affected (8.33 sec)
Records: 22673  Duplicates: 0  Warnings: 0

mysql> ALTER TABLE     shortcut_set ENGINE=InnoDB;
Query OK, 1 row affected (0.18 sec)
Records: 1  Duplicates: 0  Warnings: 0

mysql> ALTER TABLE     shortcut_set_users ENGINE=InnoDB;
Query OK, 0 rows affected (0.04 sec)
Records: 0  Duplicates: 0  Warnings: 0

mysql> ALTER TABLE     system ENGINE=InnoDB;
Query OK, 394 rows affected (0.91 sec)
Records: 394  Duplicates: 0  Warnings: 0

mysql> ALTER TABLE     system_bak ENGINE=InnoDB;
Query OK, 382 rows affected (0.84 sec)
Records: 382  Duplicates: 0  Warnings: 0

mysql> ALTER TABLE     taxonomy_index ENGINE=InnoDB;
Query OK, 379480 rows affected (22.65 sec)
Records: 379480  Duplicates: 0  Warnings: 0

mysql> ALTER TABLE     taxonomy_term_data ENGINE=InnoDB;
Query OK, 900 rows affected (1.26 sec)
Records: 900  Duplicates: 0  Warnings: 0

mysql> ALTER TABLE     taxonomy_term_hierarchy ENGINE=InnoDB;
Query OK, 900 rows affected (0.22 sec)
Records: 900  Duplicates: 0  Warnings: 0

mysql> ALTER TABLE     taxonomy_vocabulary ENGINE=InnoDB;
Query OK, 28 rows affected (0.14 sec)
Records: 28  Duplicates: 0  Warnings: 0

mysql> ALTER TABLE     trigger_assignments ENGINE=InnoDB;
Query OK, 0 rows affected (0.01 sec)
Records: 0  Duplicates: 0  Warnings: 0

mysql> ALTER TABLE     url_alias ENGINE=InnoDB;
Query OK, 42771 rows affected (9.65 sec)
Records: 42771  Duplicates: 0  Warnings: 0

mysql> ALTER TABLE     users ENGINE=InnoDB;
Query OK, 210 rows affected, 1 warning (1.34 sec)
Records: 210  Duplicates: 0  Warnings: 1

mysql> ALTER TABLE     users_roles ENGINE=InnoDB;
Query OK, 57 rows affected (0.25 sec)
Records: 57  Duplicates: 0  Warnings: 0

mysql> ALTER TABLE     variable ENGINE=InnoDB;
Query OK, 2826 rows affected (12.73 sec)
Records: 2826  Duplicates: 0  Warnings: 0

mysql> ALTER TABLE     views_display ENGINE=InnoDB;
Query OK, 160 rows affected (7.51 sec)
Records: 160  Duplicates: 0  Warnings: 0

mysql> ALTER TABLE     views_view ENGINE=InnoDB;
Query OK, 63 rows affected (1.40 sec)
Records: 63  Duplicates: 0  Warnings: 0
The server seems to be surviving with 2GB of RAM allocated to InnoDB so I have just increased that to 3GB to see how it copes.
comment:30 Changed 3 years ago by chris
- Add Hours to Ticket changed from 0 to 0.25
- Total Hours changed from 2.65 to 2.9
Perhaps 6G of RAM for this server would solve this, give 5G to MySQL and 1G for Apache...? It would save some money compared to increasing it to 8G and f it doesn't solve it there is still the option to increase it again to 8G, what do you think?
I think more RAM is needed before more changed can be made to my.cnf, see the warnings at the end here:
mysqltuner

 >>  MySQLTuner 1.3.0 - Major Hayden <major@mhtx.net>
 >>  Bug reports, feature requests, and downloads at http://mysqltuner.com/
 >>  Run with '--help' for additional options and output filtering
[OK] Logged in using credentials from debian maintenance account.
[OK] Currently running supported MySQL version 5.5.46-0+deb8u1-log
[OK] Operating on 64-bit architecture

-------- Storage Engine Statistics -------------------------------------------
[--] Status: +ARCHIVE +BLACKHOLE +CSV -FEDERATED +InnoDB +MRG_MYISAM
[--] Data in MyISAM tables: 3G (Tables: 241)
[--] Data in InnoDB tables: 5G (Tables: 1742)
[--] Data in PERFORMANCE_SCHEMA tables: 0B (Tables: 17)
[--] Data in MEMORY tables: 0B (Tables: 1)
[!!] Total fragmented tables: 1779

-------- Security Recommendations  -------------------------------------------
[OK] All database users have passwords assigned

-------- Performance Metrics -------------------------------------------------
[--] Up for: 1h 30m 41s (1M q [260.992 qps], 12K conn, TX: 1B, RX: 327M)
[--] Reads / Writes: 91% / 9%
[--] Total buffers: 3.5G global + 2.7M per thread (151 max threads)
[!!] Maximum possible memory usage: 3.9G (101% of installed RAM)
[OK] Slow queries: 0% (412/1M)
[OK] Highest usage of available connections: 37% (57/151)
[OK] Key buffer size / total MyISAM indexes: 16.0M/950.0M
[OK] Key buffer hit rate: 96.1% (4M cached / 159K reads)
[OK] Query cache efficiency: 88.7% (1M cached / 1M selects)
[OK] Query cache prunes per day: 0
[OK] Sorts requiring temporary tables: 1% (1K temp sorts / 62K sorts)
[OK] Temporary tables created on disk: 2% (576 on disk / 27K total)
[OK] Thread cache hit rate: 99% (66 created / 12K connections)
[!!] Table cache hit rate: 18% (800 open / 4K opened)
[OK] Open file limit used: 30% (529/1K)
[OK] Table locks acquired immediately: 99% (221K immediate / 221K locks)
[!!] InnoDB  buffer pool / data size: 3.0G/5.8G
[OK] InnoDB log waits: 0
-------- Recommendations -----------------------------------------------------
General recommendations:
    Run OPTIMIZE TABLE to defragment tables for better performance
    MySQL started within last 24 hours - recommendations may be inaccurate
    Reduce your overall MySQL memory footprint for system stability
    Increase table_open_cache gradually to avoid file descriptor limits
    Read this before increasing table_open_cache over 64: http://bit.ly/1mi7c4C
Variables to adjust:
  *** MySQL's maximum memory usage is dangerously high ***
  *** Add RAM before increasing MySQL buffer variables ***
    table_open_cache (> 800)
    innodb_buffer_pool_size (>= 5G)
comment:31 Changed 3 years ago by chris
- Add Hours to Ticket changed from 0 to 0.5
- Total Hours changed from 2.9 to 3.4
The changes made yesterday have solved the issue with the number of php5-fpm processes, apart from the massive spike after midnight, I suspect this is when the databases were being dumped for backup.
This is the latest mysqltuner output:
 >>  MySQLTuner 1.3.0 - Major Hayden <major@mhtx.net>
 >>  Bug reports, feature requests, and downloads at http://mysqltuner.com/
 >>  Run with '--help' for additional options and output filtering
[OK] Logged in using credentials from debian maintenance account.
[OK] Currently running supported MySQL version 5.5.46-0+deb8u1-log
[OK] Operating on 64-bit architecture

-------- Storage Engine Statistics -------------------------------------------
[--] Status: +ARCHIVE +BLACKHOLE +CSV -FEDERATED +InnoDB +MRG_MYISAM
[--] Data in MyISAM tables: 3G (Tables: 241)
[--] Data in PERFORMANCE_SCHEMA tables: 0B (Tables: 17)
[--] Data in InnoDB tables: 5G (Tables: 1742)
[--] Data in MEMORY tables: 0B (Tables: 1)
[!!] Total fragmented tables: 1780

-------- Security Recommendations  -------------------------------------------
[OK] All database users have passwords assigned

-------- Performance Metrics -------------------------------------------------
[--] Up for: 17h 11m 42s (8M q [143.256 qps], 99K conn, TX: 18B, RX: 1B)
[--] Reads / Writes: 95% / 5%
[--] Total buffers: 3.5G global + 2.7M per thread (151 max threads)
[!!] Maximum possible memory usage: 3.9G (101% of installed RAM)
[OK] Slow queries: 0% (1K/8M)
[OK] Highest usage of available connections: 37% (57/151)
[OK] Key buffer size / total MyISAM indexes: 16.0M/950.1M
[OK] Key buffer hit rate: 96.3% (23M cached / 855K reads)
[OK] Query cache efficiency: 88.5% (7M cached / 8M selects)
[!!] Query cache prunes per day: 528132
[OK] Sorts requiring temporary tables: 1% (3K temp sorts / 311K sorts)
[OK] Temporary tables created on disk: 6% (11K on disk / 173K total)
[OK] Thread cache hit rate: 99% (692 created / 99K connections)
[!!] Table cache hit rate: 3% (800 open / 21K opened)
[OK] Open file limit used: 1% (33/1K)
[OK] Table locks acquired immediately: 99% (1M immediate / 1M locks)
[!!] InnoDB  buffer pool / data size: 3.0G/5.8G
[OK] InnoDB log waits: 0
-------- Recommendations -----------------------------------------------------
General recommendations:
    Run OPTIMIZE TABLE to defragment tables for better performance
    MySQL started within last 24 hours - recommendations may be inaccurate
    Reduce your overall MySQL memory footprint for system stability
    Increasing the query_cache size over 128M may reduce performance
    Increase table_open_cache gradually to avoid file descriptor limits
    Read this before increasing table_open_cache over 64: http://bit.ly/1mi7c4C
Variables to adjust:
  *** MySQL's maximum memory usage is dangerously high ***
  *** Add RAM before increasing MySQL buffer variables ***
    query_cache_size (> 512M) [see warning above]
    table_open_cache (> 800)
    innodb_buffer_pool_size (>= 5G)
I have sent a email to 1984 regarding increasing the size of the virtual server.
It is worth noting that 6 months ago, ticket:9#comment:19 we had:
[--] Data in MyISAM tables: 1G (Tables: 79)
[--] Data in InnoDB tables: 839M (Tables: 512)
So we have seen a massive increase in the amount of data in MySQL tables, now we have:
[--] Data in MyISAM tables: 3G (Tables: 241)
[--] Data in InnoDB tables: 5G (Tables: 1742)
comment:32 Changed 3 years ago by chris
- Add Hours to Ticket changed from 0 to 0.5
- Total Hours changed from 3.4 to 3.9
Crin1 has been rebooted with 8GB of RAM, here is the result of mysqltuner:
 >>  MySQLTuner 1.3.0 - Major Hayden <major@mhtx.net>
 >>  Bug reports, feature requests, and downloads at http://mysqltuner.com/
 >>  Run with '--help' for additional options and output filtering
[OK] Logged in using credentials from debian maintenance account.
[OK] Currently running supported MySQL version 5.5.46-0+deb8u1-log
[OK] Operating on 64-bit architecture

-------- Storage Engine Statistics -------------------------------------------
[--] Status: +ARCHIVE +BLACKHOLE +CSV -FEDERATED +InnoDB +MRG_MYISAM
[--] Data in MyISAM tables: 3G (Tables: 241)
[--] Data in MEMORY tables: 0B (Tables: 1)
[--] Data in PERFORMANCE_SCHEMA tables: 0B (Tables: 17)
[--] Data in InnoDB tables: 5G (Tables: 1742)
[!!] Total fragmented tables: 1779

-------- Security Recommendations  -------------------------------------------
[OK] All database users have passwords assigned

-------- Performance Metrics -------------------------------------------------
[--] Up for: 48m 35s (540K q [185.271 qps], 5K conn, TX: 596M, RX: 121M)
[--] Reads / Writes: 99% / 1%
[--] Total buffers: 6.5G global + 2.7M per thread (151 max threads)
[!!] Maximum possible memory usage: 6.9G (88% of installed RAM)
[OK] Slow queries: 0% (7/540K)
[OK] Highest usage of available connections: 5% (8/151)
[!!] Key buffer size / total MyISAM indexes: 16.0M/950.1M
[!!] Key buffer hit rate: 92.0% (150 cached / 12 reads)
[OK] Query cache efficiency: 89.3% (467K cached / 522K selects)
[OK] Query cache prunes per day: 0
[OK] Sorts requiring temporary tables: 1% (438 temp sorts / 23K sorts)
[OK] Temporary tables created on disk: 2% (207 on disk / 8K total)
[OK] Thread cache hit rate: 99% (8 created / 5K connections)
[!!] Table cache hit rate: 6% (800 open / 12K opened)
[OK] Open file limit used: 9% (165/1K)
[OK] Table locks acquired immediately: 100% (76K immediate / 76K locks)
[OK] InnoDB buffer pool / data size: 6.0G/5.8G
[OK] InnoDB log waits: 0
-------- Recommendations -----------------------------------------------------
General recommendations:
    Run OPTIMIZE TABLE to defragment tables for better performance
    MySQL started within last 24 hours - recommendations may be inaccurate
    Reduce your overall MySQL memory footprint for system stability
    Increase table_open_cache gradually to avoid file descriptor limits
    Read this before increasing table_open_cache over 64: http://bit.ly/1mi7c4C
Variables to adjust:
    key_buffer_size (> 950.1M)
    table_open_cache (> 800)
So I have changed these in /etc/mysql/my.cnf:
#key_buffer             = 16M
key_buffer              = 1024M

#table_open_cache       = 800
table_open_cache        = 2000
And restarted MySQL.
comment:33 Changed 3 years ago by chris
- Add Hours to Ticket changed from 0 to 0.15
- Total Hours changed from 3.9 to 4.05
I read this http://bit.ly/1mi7c4C and changed the table_open_cache to 64.
Changed 3 years ago by chris
Changed 3 years ago by chris
Changed 3 years ago by chris
comment:34 Changed 3 years ago by chris
- Add Hours to Ticket changed from 0 to 1
- Resolution set to fixed
- Status changed from new to closed
- Total Hours changed from 4.05 to 5.05
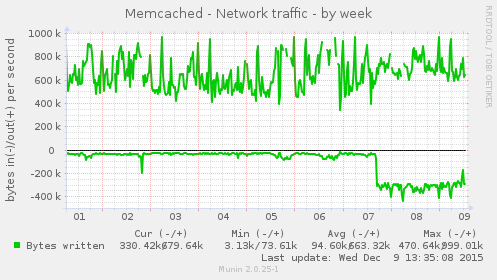
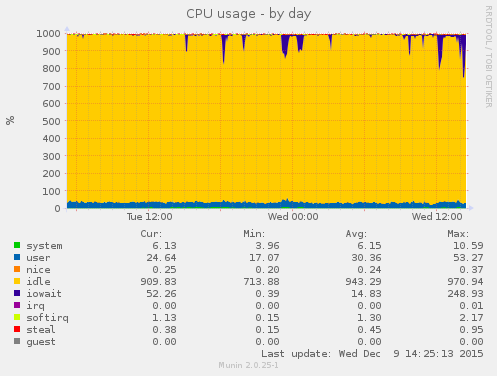
Crin1 is now running with 8GB of RAM and using it all (even more would be ideal):
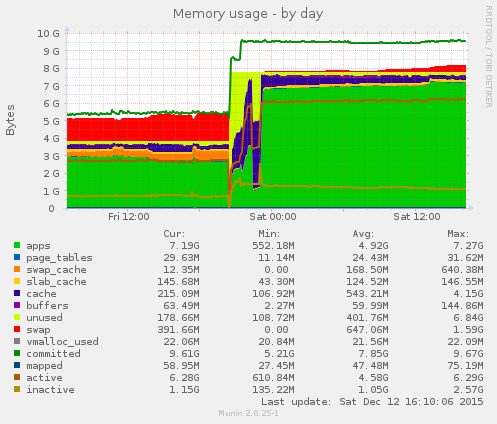
This is almost all being used by MySQL:
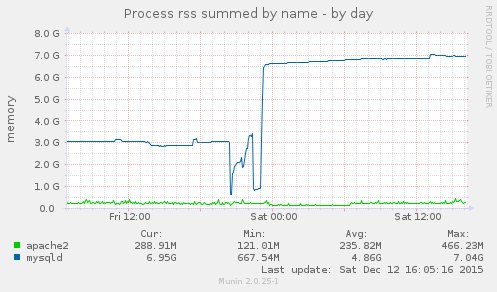
The issue this ticket was opened for, the number of php5-fpm processes on Crin2 is also resolved:
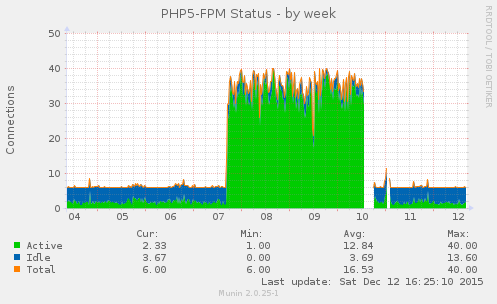
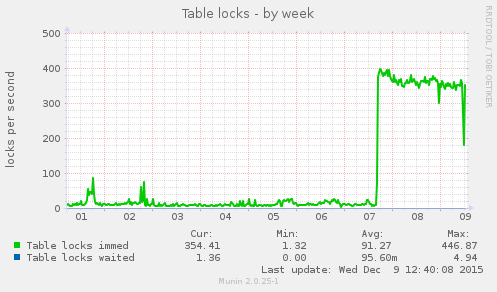
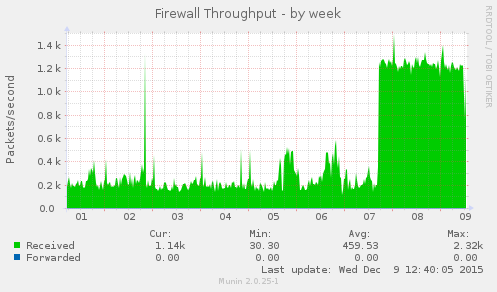
So I'm closing this ticket, we can follow things up on a new one if needs be. The time being recorded is for time spent looking at Munin graphs.
These graphs should the corresponding changes in MySQL on Crin1: