Opened 3 years ago
Closed 3 years ago
#9 closed task (fixed)
Monitor and adjust server settings after Crin1 and Crin2 server go live
| Reported by: | chris | Owned by: | chris |
|---|---|---|---|
| Priority: | major | Milestone: | Make Crin1 and Crin2 live and monitor |
| Component: | crin1 | Version: | |
| Keywords: | Cc: | jenny, gillian | |
| Estimated Number of Hours: | 4 | Add Hours to Ticket: | 0 |
| Billable?: | yes | Total Hours: | 9.22 |
Attachments (14)
Change History (41)
comment:1 Changed 3 years ago by chris
- Add Hours to Ticket changed from 0 to 0.15
- Total Hours set to 0.15
comment:2 Changed 3 years ago by chris
- Add Hours to Ticket changed from 0 to 0.35
- Total Hours changed from 0.15 to 0.5
Regarding APC, according to /usr/share/doc/php5-apcu/INSTALL.gz:
Suggested Configuration (in your php.ini file)
----------------------------------------------
  extension=apcu.so
  apc.enabled=1
  apc.shm_size=32M
  apc.ttl=7200
  apc.enable_cli=1

Next you must edit your php.ini file, which is normally located in
/usr/local/php/lib/php.ini, and add the following line:

    extension="apcu.so"
We have /etc/php5/fpm/conf.d/20-apcu.ini which is a symlink to /etc/php5/mods-available/apcu.ini and contains:
extension=apcu.so

apc.enabled=1
apc.shm_size=128M
apc.max_file_size=1M
But we don't have extension="apcu.so" in a php.ini file, so /etc/php5/fpm/php.ini was edited to add:
extension=apcu.so
And php-fpm was restarted:
service php5-fpm restart
Test to see if we now have some stats on the command line:
cd /etc/munin/plugins
munin-run php_apc_files
used.value 32992
free.value 134184600
hits.value 0.00
misses.value 0.00
request_rate.value 0.00
hit_rate.value 0.00
miss_rate.value 0.00
insert_rate.value 0.00
entries.value 0
inserts.value 0
purges.value U
purge_rate.value 100.00
fragmented.value 0.00
fragment_segments.value 0
fragment_percentage.value 0.00
optcode_size.value 0
user_size.value 0
user_hits.value 0.00
user_misses.value 0.00
user_request_rate.value 0.00
user_hit_rate.value 0.00
user_miss_rate.value 0.00
user_insert_rate.value 0.00
user_entries.value 0
user_inserts.value 0
user_purges.value U
user_purge_rate.value 0.00
We don't, so this hasn't solve the issues of APC not being used.
Changed 3 years ago by chris
comment:3 Changed 3 years ago by chris
- Add Hours to Ticket changed from 0 to 0.1
- Total Hours changed from 0.5 to 0.6
I created a php info file containing:
<?php phpinfo(); ?>
To check if APC is enabled and it is:
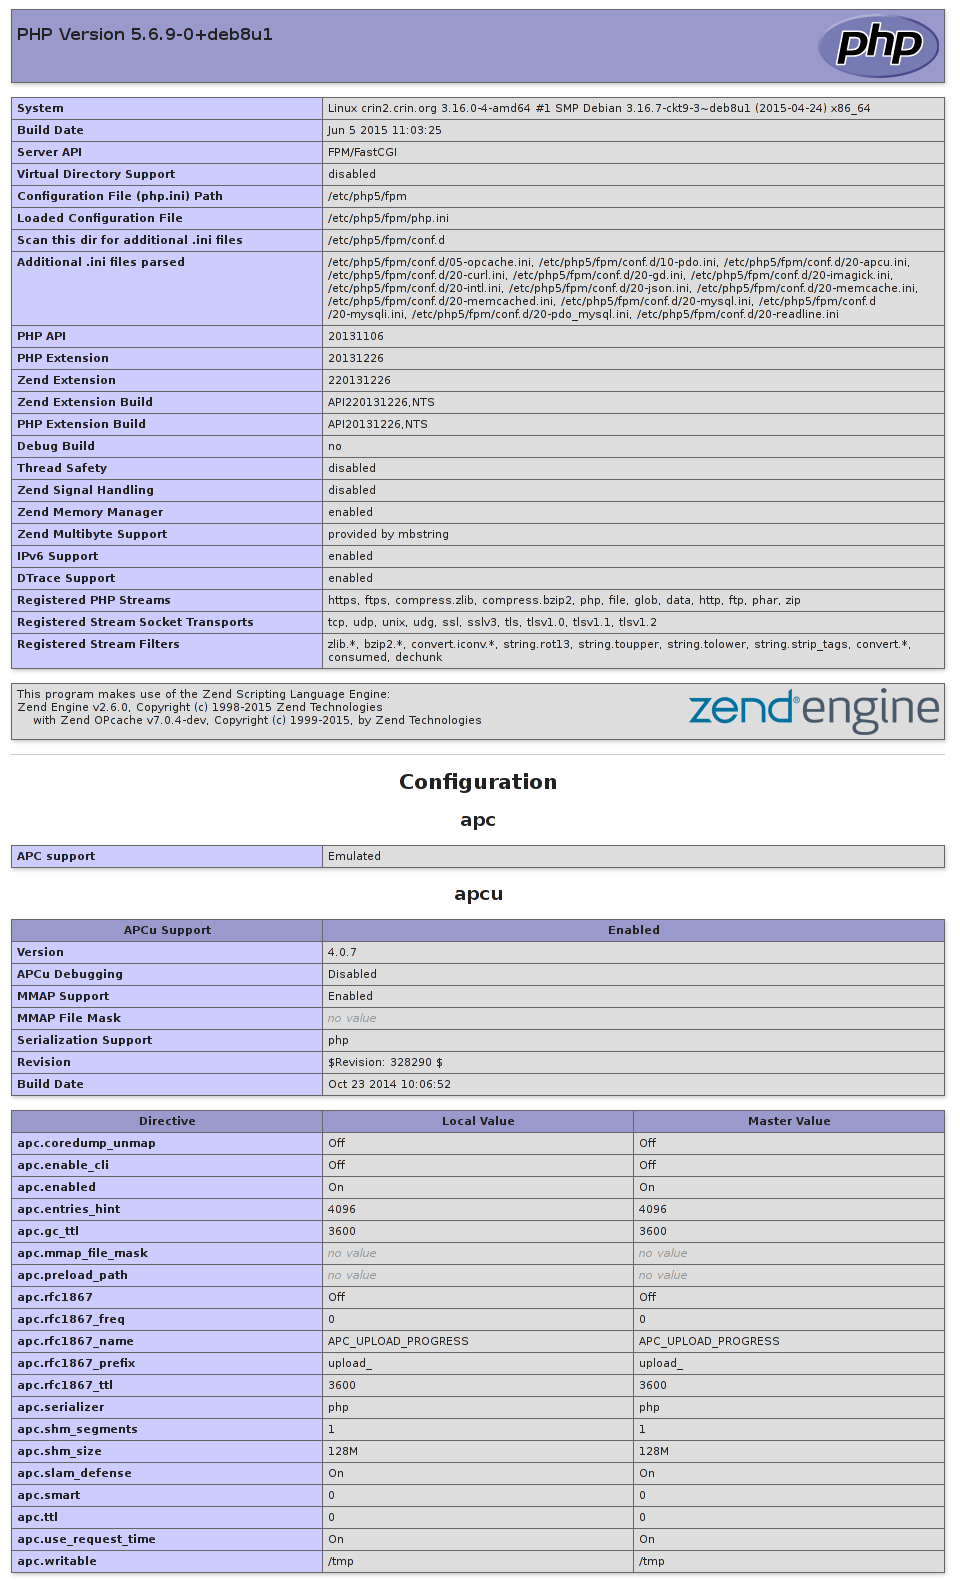
So more investigation is needed regarding why it isn't being used.
comment:4 Changed 3 years ago by chris
- Add Hours to Ticket changed from 0 to 0.1
- Total Hours changed from 0.6 to 0.7
The server just sent this email:
Date: Sun, 14 Jun 2015 13:39:01 +0000
From: Cron Daemon <root@crin2.crin.org>
To: root@crin2.crin.org
Subject: Cron <root@crin2>   [ -x /usr/lib/php5/sessionclean ] && /usr/lib/php5/sessionclean

PHP Warning:  Module 'apcu' already loaded in Unknown on line 0
So I have commented extension=apcu.so out from /etc/php5/fpm/php.ini and restarted php5-fpm.
comment:5 Changed 3 years ago by chris
- Add Hours to Ticket changed from 0 to 0.25
- Total Hours changed from 0.7 to 0.95
Jenny sent a email saying:
The speed seems to be slow.
So, I have allocated more memory to memcache:
# Start with a cap of 64 megs of memory. It's reasonable, and the daemon default
# Note that the daemon will grow to this size, but does not start out holding this much
# memory
#-m 64
-m 256
I have also increased the max number of php-fpm processes from 5 to 10, in /etc/php5/fpm/pool.d/www.conf:
;pm.max_children = 5
pm.max_children = 10
I'll keep an eye on the Munin graphs today and also try to get to the bottom of why APC isn't working.
comment:6 Changed 3 years ago by chris
- Add Hours to Ticket changed from 0 to 0.45
- Total Hours changed from 0.95 to 1.4
Email from Jenny:
I'm afraid we can't edit any pages - we just get a blank page when we try, eg: node/41556
To test this, generate a one time login:
su - www-data -s /bin/bash
cd drupal/
drush uli
And I get:
502 Bad Gateway
In the Nginx error log there are a lot of errors like this:
2015/06/15 08:51:17 [error] 6144#0: *2879 connect() to unix:/var/run/php5-fpm.sock failed (11: Resource temporarily unavailable) while connecting to upstream, client: 127.0.0.1, server: localhost, request: "GET /status HTTP/1.1", upstream: "fastcgi://unix:/var/run/php5-fpm.sock:", host: "127.0.0.1:80"
php-fpm appears to be running:
service php5-fpm status
● php5-fpm.service - The PHP FastCGI Process Manager
   Loaded: loaded (/lib/systemd/system/php5-fpm.service; enabled)
   Active: active (running) since Mon 2015-06-15 08:39:08 GMT; 17min ago
  Process: 6902 ExecStartPre=/usr/lib/php5/php5-fpm-checkconf (code=exited, status=0/SUCCESS)
 Main PID: 6908 (php5-fpm)
   Status: "Processes active: 10, idle: 0, Requests: 744, slow: 0, Traffic: 0req/sec"
   CGroup: /system.slice/php5-fpm.service
           ├─6908 php-fpm: master process (/etc/php5/fpm/php-fpm.conf)
           ├─7749 php-fpm: pool www
           ├─8158 php-fpm: pool www
           ├─8159 php-fpm: pool www
           ├─8160 php-fpm: pool www
           ├─8161 php-fpm: pool www
           ├─8162 php-fpm: pool www
           ├─8163 php-fpm: pool www
           ├─8164 php-fpm: pool www
           ├─8165 php-fpm: pool www
           └─8166 php-fpm: pool www
Note the Traffic: 0req/sec" -- this appears to indicvate a problem, restarting it...
php5-fpm stop
php5-fpm status
● php5-fpm.service - The PHP FastCGI Process Manager
   Loaded: loaded (/lib/systemd/system/php5-fpm.service; enabled)
   Active: inactive (dead) since Mon 2015-06-15 08:57:31 GMT; 3s ago
  Process: 6908 ExecStart=/usr/sbin/php5-fpm --nodaemonize --fpm-config /etc/php5/fpm/php-fpm.conf (code=exited, status=0/SUCCESS)
  Process: 6902 ExecStartPre=/usr/lib/php5/php5-fpm-checkconf (code=exited, status=0/SUCCESS)
 Main PID: 6908 (code=exited, status=0/SUCCESS)
   Status: "Processes active: 10, idle: 0, Requests: 762, slow: 0, Traffic: 1.1req/sec"
service php5-fpm start
service php5-fpm status
● php5-fpm.service - The PHP FastCGI Process Manager
   Loaded: loaded (/lib/systemd/system/php5-fpm.service; enabled)
   Active: active (running) since Mon 2015-06-15 08:57:42 GMT; 28s ago
  Process: 9451 ExecStartPre=/usr/lib/php5/php5-fpm-checkconf (code=exited, status=0/SUCCESS)
 Main PID: 9459 (php5-fpm)
   Status: "Processes active: 2, idle: 4, Requests: 20, slow: 0, Traffic: 0.9req/sec"
   CGroup: /system.slice/php5-fpm.service
           ├─9459 php-fpm: master process (/etc/php5/fpm/php-fpm.conf)
           ├─9464 php-fpm: pool www
           ├─9465 php-fpm: pool www
           ├─9466 php-fpm: pool www
           ├─9467 php-fpm: pool www
           └─9468 php-fpm: pool www
Regarding the edit problem, this is confirmed:
Looking at the HTTP headers, it is a 500 internal server error:
GET /en/node/41556/edit HTTP/1.1
Host: www.crin.org
User-Agent: Mozilla/5.0 (X11; Linux x86_64; rv:38.0) Gecko/20100101 Firefox/38.0
Accept: text/html,application/xhtml+xml,application/xml;q=0.9,*/*;q=0.8
Accept-Language: en-GB,en;q=0.5
Accept-Encoding: gzip, deflate
DNT: 1
Cookie: has_js=1; ccShowCookieIcon=no; crin_cookiecontrol=yes; SSESSXXXX
Referer: https://www.crin.org/
Connection: keep-alive
If-Modified-Since: Mon, 15 Jun 2015 09:04:09 +0000
If-None-Match: "1434359049"

HTTP/1.1 500 Internal Server Error
Server: nginx/1.6.2
Date: Mon, 15 Jun 2015 09:05:36 GMT
Content-Type: text/html; charset=utf-8
Expires: Sun, 19 Nov 1978 05:00:00 GMT
Last-Modified: Mon, 15 Jun 2015 09:05:27 +0000
Cache-Control: no-cache, must-revalidate, post-check=0, pre-check=0
Etag: "1434359127"
Content-Language: en
X-Firefox-Spdy: 3.1
All we have in the php-fpm log are a lot of entries like this:
[15-Jun-2015 09:02:36] WARNING: [pool www] server reached pm.max_children setting (10), consider raising it
[15-Jun-2015 09:04:59] WARNING: [pool www] server reached pm.max_children setting (10), consider raising it
[15-Jun-2015 09:07:18] WARNING: [pool www] seems busy (you may need to increase pm.start_servers, or pm.min/max_spare_servers), spawning 8 children, there are 0 idle, and 9 total children
[15-Jun-2015 09:07:42] WARNING: [pool www] seems busy (you may need to increase pm.start_servers, or pm.min/max_spare_servers), spawning 8 children, there are 0 idle, and 8 total children
[15-Jun-2015 09:08:07] WARNING: [pool www] seems busy (you may need to increase pm.start_servers, or pm.min/max_spare_servers), spawning 8 children, there are 0 idle, and 8 total children
(Note the server is on GMT so 9:08 is actually 10:08 BST.)
We don't have php-fpm error logs, so uncommenting these lines in /etc/php5/fpm/pool.d/www.conf:
php_admin_value[error_log] = /var/log/fpm-php.www.log
php_admin_flag[log_errors] = on
And php-fpm was restarted -- without some indication regarding the resons for the 500 Internal Server Error it will be very hard to solve.
Touch the chown the log, so that it is written to:
touch /var/log/fpm-php.www.log
chown www-data:www-data /var/log/fpm-php.www.log
service php5-fpm restart
Now we have lots of issues to address:
[15-Jun-2015 10:17:34 Europe/London] PHP Parse error:  syntax error, unexpected end of file in /var/www/drupal/sites/default/themes/crin/templates/node--country.tpl.php on line 522
[15-Jun-2015 10:18:15 Europe/London] PHP Parse error:  syntax error, unexpected end of file in /var/www/drupal/sites/default/themes/crin/templates/node--country.tpl.php on line 522
[15-Jun-2015 10:18:38 Europe/London] PHP Parse error:  syntax error, unexpected end of file in /var/www/drupal/sites/default/themes/crin/templates/node--country.tpl.php on line 522
[15-Jun-2015 10:18:56 Europe/London] PHP Notice:  MemcachePool::set(): Server 127.0.0.1 (tcp 11211, udp 0) failed with: SERVER_ERROR object too large for cache
 (3) in /var/www/drupal/sites/all/modules/memcache/dmemcache.inc on line 51
[15-Jun-2015 10:18:57 Europe/London] PHP Strict Standards:  Only variables should be passed by reference in /var/www/drupal/sites/all/modules/views/plugins/views_plugin_argument_default_php.inc(53) : eval()'d code on line 1
[15-Jun-2015 10:18:58 Europe/London] PHP Fatal error:  Allowed memory size of 134217728 bytes exhausted (tried to allocate 4147733 bytes) in /var/www/drupal/includes/theme.inc on line 1520
[15-Jun-2015 10:19:05 Europe/London] PHP Parse error:  syntax error, unexpected end of file in /var/www/drupal/sites/default/themes/crin/templates/node--country.tpl.php on line 522
[15-Jun-2015 09:19:42 UTC] PHP Warning:  Unknown: failed to open stream: Permission denied in Unknown on line 0
[15-Jun-2015 10:19:52 Europe/London] PHP Parse error:  syntax error, unexpected end of file in /var/www/drupal/sites/default/themes/crin/templates/node--country.tpl.php on line 522
[15-Jun-2015 09:20:02 UTC] PHP Notice:  Undefined index: expunges in /var/www/localhost/apc-info.php on line 54
[15-Jun-2015 09:20:02 UTC] PHP Notice:  Undefined index: expunges in /var/www/localhost/apc-info.php on line 71
[15-Jun-2015 09:20:02 UTC] PHP Warning:  Division by zero in /var/www/localhost/apc-info.php on line 79
[15-Jun-2015 09:20:02 UTC] PHP Warning:  Division by zero in /var/www/localhost/apc-info.php on line 80
[15-Jun-2015 09:20:02 UTC] PHP Warning:  Division by zero in /var/www/localhost/apc-info.php on line 88
[15-Jun-2015 09:20:03 UTC] PHP Notice:  Undefined index: expunges in /var/www/localhost/apc-info.php on line 54
[15-Jun-2015 09:20:03 UTC] PHP Notice:  Undefined index: expunges in /var/www/localhost/apc-info.php on line 71
[15-Jun-2015 09:20:03 UTC] PHP Warning:  Division by zero in /var/www/localhost/apc-info.php on line 79
[15-Jun-2015 09:20:03 UTC] PHP Warning:  Division by zero in /var/www/localhost/apc-info.php on line 80
[15-Jun-2015 09:20:03 UTC] PHP Warning:  Division by zero in /var/www/localhost/apc-info.php on line 88
[15-Jun-2015 10:20:05 Europe/London] PHP Parse error:  syntax error, unexpected end of file in /var/www/drupal/sites/default/themes/crin/templates/node--country.tpl.php on line 522
[15-Jun-2015 09:20:05 UTC] PHP Notice:  Undefined index: expunges in /var/www/localhost/apc-info.php on line 54
[15-Jun-2015 09:20:05 UTC] PHP Notice:  Undefined index: expunges in /var/www/localhost/apc-info.php on line 71
[15-Jun-2015 09:20:05 UTC] PHP Warning:  Division by zero in /var/www/localhost/apc-info.php on line 79
[15-Jun-2015 09:20:05 UTC] PHP Warning:  Division by zero in /var/www/localhost/apc-info.php on line 80
[15-Jun-2015 09:20:05 UTC] PHP Warning:  Division by zero in /var/www/localhost/apc-info.php on line 88
[15-Jun-2015 09:20:06 UTC] PHP Notice:  Undefined index: expunges in /var/www/localhost/apc-info.php on line 54
[15-Jun-2015 09:20:06 UTC] PHP Notice:  Undefined index: expunges in /var/www/localhost/apc-info.php on line 71
[15-Jun-2015 09:20:06 UTC] PHP Warning:  Division by zero in /var/www/localhost/apc-info.php on line 79
[15-Jun-2015 09:20:06 UTC] PHP Warning:  Division by zero in /var/www/localhost/apc-info.php on line 80
[15-Jun-2015 09:20:06 UTC] PHP Warning:  Division by zero in /var/www/localhost/apc-info.php on line 88
comment:7 Changed 3 years ago by chris
- Add Hours to Ticket changed from 0 to 0.2
- Total Hours changed from 1.4 to 1.6
This is the error we get when trying to edit pages:
[15-Jun-2015 10:38:53 Europe/London] PHP Notice:  MemcachePool::set(): Server 127.0.0.1 (tcp 11211, udp 0) failed with: SERVER_ERROR object too large for cache
 (3) in /var/www/drupal/sites/all/modules/memcache/dmemcache.inc on line 51
In /etc/php5/fpm/conf.d we have these sym links:
20-memcached.ini -> ../../mods-available/memcached.ini
20-memcache.ini -> ../../mods-available/memcache.ini
And those file contain:
; uncomment the next line to enable the module
extension=memcached.so
; uncomment the next line to enable the module
extension=memcache.so

[memcache]
memcache.dbpath="/var/lib/memcache"
memcache.maxreclevel=0
memcache.maxfiles=0
memcache.archivememlim=0
memcache.maxfilesize=0
memcache.maxratio=0
Looking at documentation for memcache.maxfilesize ...
comment:8 Changed 3 years ago by chris
- Add Hours to Ticket changed from 0 to 0.25
- Total Hours changed from 1.6 to 1.85
I have tried increasing the memory allocated to memcache to 2GB, in /etc/memcached.conf:
# Start with a cap of 64 megs of memory. It's reasonable, and the daemon default
# Note that the daemon will grow to this size, but does not start out holding this much
# memory
#-m 64
-m 2048
But still trying to edit pages results in:
[15-Jun-2015 11:08:34 Europe/London] PHP Notice:  MemcachePool::set(): Server 127.0.0.1 (tcp 11211, udp 0) failed with: SERVER_ERROR object too large for cache
 (3) in /var/www/drupal/sites/all/modules/memcache/dmemcache.inc on line 51
[15-Jun-2015 11:08:35 Europe/London] PHP Strict Standards:  Only variables should be passed by reference in /var/www/drupal/sites/all/modules/views/plugins/views_plugin_argument_default_php.inc(53) : eval()'d code on line 1
[15-Jun-2015 11:08:40 Europe/London] PHP Fatal error:  Allowed memory size of 134217728 bytes exhausted (tried to allocate 4104 bytes) in /var/www/drupal/sites/all/modules/admin_menu/admin_menu.inc on line 222
I can't find any documentation regarding settings for memcache.maxfilesize on https://www.php.net/
Trying to increase the memory allocated to php-fpm processes, in /etc/php5/fpm/php.ini this variable was changed:
; Maximum amount of memory a script may consume (128MB)
; http://php.net/memory-limit
;memory_limit = 128M
memory_limit = 256M
And php-fpm was restarted and now editing documents works, so reducing memcache memory back to 512M, in /etc/memcached.conf:
#-m 64
-m 512
comment:9 Changed 3 years ago by chris
- Add Hours to Ticket changed from 0 to 0.68
- Total Hours changed from 1.85 to 2.53
Trying to get to the bottom of the APC issue, /etc/munin/plugin-conf.d/munin-node contains:
[php_apc_*]
user root
env.url http://localhost/apc-info.php?auto
Accessing that URL generates a timeout:
lynx -dump http://localhost/apc-info.php?auto
                            504 Gateway Time-out
     __________________________________________________________________

                                 nginx/1.6.2
And a bad gateway:
lynx -dump http://localhost/apc-info.php?auto
                               502 Bad Gateway
     __________________________________________________________________

                                 nginx/1.6.2
And these errors in /var/log/fpm-php.www.log:
[15-Jun-2015 10:34:07 UTC] PHP Notice:  Undefined index: expunges in /var/www/localhost/apc-info.php on line 54
[15-Jun-2015 10:34:07 UTC] PHP Notice:  Undefined index: expunges in /var/www/localhost/apc-info.php on line 71
[15-Jun-2015 10:34:07 UTC] PHP Warning:  Division by zero in /var/www/localhost/apc-info.php on line 79
[15-Jun-2015 10:34:07 UTC] PHP Warning:  Division by zero in /var/www/localhost/apc-info.php on line 80
[15-Jun-2015 10:34:07 UTC] PHP Warning:  Division by zero in /var/www/localhost/apc-info.php on line 88
php-fpm appears to be stuck:
service php5-fpm status
● php5-fpm.service - The PHP FastCGI Process Manager
   Loaded: loaded (/lib/systemd/system/php5-fpm.service; enabled)
   Active: active (running) since Mon 2015-06-15 10:12:44 GMT; 24min ago
  Process: 19697 ExecStartPre=/usr/lib/php5/php5-fpm-checkconf (code=exited, status=0/SUCCESS)
 Main PID: 19703 (php5-fpm)
   Status: "Processes active: 10, idle: 0, Requests: 970, slow: 0, Traffic: 0.1req/sec"
   CGroup: /system.slice/php5-fpm.service
           ├─19703 php-fpm: master process (/etc/php5/fpm/php-fpm.conf)
           ├─20431 php-fpm: pool www
           ├─21005 php-fpm: pool www
           ├─21007 php-fpm: pool www
           ├─21008 php-fpm: pool www
           ├─21009 php-fpm: pool www
           ├─21010 php-fpm: pool www
           ├─21011 php-fpm: pool www
           ├─21012 php-fpm: pool www
           ├─21013 php-fpm: pool www
           └─21014 php-fpm: pool www
So:
service php5-fpm stop
service php5-fpm status
● php5-fpm.service - The PHP FastCGI Process Manager
   Loaded: loaded (/lib/systemd/system/php5-fpm.service; enabled)
   Active: inactive (dead) since Mon 2015-06-15 10:37:45 GMT; 3s ago
  Process: 19703 ExecStart=/usr/sbin/php5-fpm --nodaemonize --fpm-config /etc/php5/fpm/php-fpm.conf (code=exited, status=0/SUCCESS)
  Process: 19697 ExecStartPre=/usr/lib/php5/php5-fpm-checkconf (code=exited, status=0/SUCCESS)
 Main PID: 19703 (code=exited, status=0/SUCCESS)
   Status: "Processes active: 10, idle: 0, Requests: 973, slow: 0, Traffic: 0.1req/sec"
service php5-fpm start
service php5-fpm status
● php5-fpm.service - The PHP FastCGI Process Manager
   Loaded: loaded (/lib/systemd/system/php5-fpm.service; enabled)
   Active: active (running) since Mon 2015-06-15 10:37:55 GMT; 27s ago
  Process: 23057 ExecStartPre=/usr/lib/php5/php5-fpm-checkconf (code=exited, status=0/SUCCESS)
 Main PID: 23065 (php5-fpm)
   Status: "Processes active: 10, idle: 0, Requests: 11, slow: 0, Traffic: 0.5req/sec"
   CGroup: /system.slice/php5-fpm.service
           ├─23065 php-fpm: master process (/etc/php5/fpm/php-fpm.conf)
           ├─23067 php-fpm: pool www
           ├─23068 php-fpm: pool www
           ├─23069 php-fpm: pool www
           ├─23070 php-fpm: pool www
           ├─23071 php-fpm: pool www
           ├─23072 php-fpm: pool www
           ├─23073 php-fpm: pool www
           ├─23074 php-fpm: pool www
           ├─23075 php-fpm: pool www
           └─23076 php-fpm: pool www
Things appears to be working better with fewer php-fpm processes, so droppig the max back to 5 from 10, but that didn't help, in fact things seemed to get worse, so it has now been increased to 20, but still lot of 502 errors and the site is very slow... so dropping it back to the original 5 max processes...
Trying to get APC working:
su www-data -s /bin/bash
cd /var/www/localhost
apc-info.php
PHP Warning:  apc_sma_info(): No APC SMA info available.  Perhaps APC is disabled via apc.enabled? in /var/www/localhost/apc-info.php on line 15
PHP Warning:  Division by zero in /var/www/localhost/apc-info.php on line 79
PHP Warning:  Division by zero in /var/www/localhost/apc-info.php on line 80
PHP Warning:  Division by zero in /var/www/localhost/apc-info.php on line 88
PHP Warning:  Division by zero in /var/www/localhost/apc-info.php on line 89
size: 0 used: 0 free: 0 hits: 0.00 misses: 0.00 request_rate: 0.00 hit_rate: 0.00 miss_rate: 0.00 insert_rate: 0.00 entries:  inserts:  purges:  purge_rate: 100.00 fragment_percentage: 0.00 fragmented: 0.00 fragment_segments: 0 optcode_size:  user_size:  user_hits: 0.00 user_misses: 0.00 user_request_rate: 0.00 user_hit_rate: 0.00 user_miss_rate: 0.00 user_insert_rate: 0.00 user_entries:  user_inserts:  user_purges:  user_purge_rate: 0.00
Following the suggestion here /etc/php5/mods-available/apcu.ini was edited to add:
apc.enable_cli=1
That solved one problem:
php apc-info.php
PHP Warning:  Division by zero in /var/www/localhost/apc-info.php on line 49
PHP Warning:  Division by zero in /var/www/localhost/apc-info.php on line 50
PHP Warning:  Division by zero in /var/www/localhost/apc-info.php on line 51
PHP Warning:  Division by zero in /var/www/localhost/apc-info.php on line 52
PHP Notice:  Undefined index: expunges in /var/www/localhost/apc-info.php on line 54
PHP Warning:  Division by zero in /var/www/localhost/apc-info.php on line 66
PHP Warning:  Division by zero in /var/www/localhost/apc-info.php on line 67
PHP Warning:  Division by zero in /var/www/localhost/apc-info.php on line 68
PHP Warning:  Division by zero in /var/www/localhost/apc-info.php on line 69
PHP Notice:  Undefined index: expunges in /var/www/localhost/apc-info.php on line 71
PHP Warning:  Division by zero in /var/www/localhost/apc-info.php on line 79
PHP Warning:  Division by zero in /var/www/localhost/apc-info.php on line 80
PHP Warning:  Division by zero in /var/www/localhost/apc-info.php on line 88
size: 134217592 used: 32992 free: 134184600 hits: 0.00 misses: 0.00 request_rate: 0.00 hit_rate: 0.00 miss_rate: 0.00 insert_rate: 0.00 entries: 0 inserts: 0 purges:  purge_rate: 100.00 fragment_percentage: 0.00 fragmented: 0.00 fragment_segments: 0 optcode_size: 0 user_size: 0 user_hits: 0.00 user_misses: 0.00 user_request_rate: 0.00 user_hit_rate: 0.00 user_miss_rate: 0.00 user_insert_rate: 0.00 user_entries: 0 user_inserts: 0 user_purges:  user_purge_rate: 0.00
But still people are getting 502's and the site is very slow.
php-fpm is almost managing to serve two requests a second:
service php5-fpm status
● php5-fpm.service - The PHP FastCGI Process Manager
   Loaded: loaded (/lib/systemd/system/php5-fpm.service; enabled)
   Active: active (running) since Mon 2015-06-15 11:00:09 GMT; 6min ago
  Process: 26752 ExecStartPre=/usr/lib/php5/php5-fpm-checkconf (code=exited, status=0/SUCCESS)
 Main PID: 26758 (php5-fpm)
   Status: "Processes active: 5, idle: 0, Requests: 234, slow: 0, Traffic: 1.1req/sec"
   CGroup: /system.slice/php5-fpm.service
           ├─26758 php-fpm: master process (/etc/php5/fpm/php-fpm.conf)
           ├─26762 php-fpm: pool www
           ├─26763 php-fpm: pool www
           ├─26895 php-fpm: pool www
           ├─26896 php-fpm: pool www
           └─26897 php-fpm: pool www
This is clearly hopeless given the server has 4GB of RAM...
comment:10 Changed 3 years ago by chris
- Add Hours to Ticket changed from 0 to 1.3
- Total Hours changed from 2.53 to 3.83
Trying to debug the APC issue:
locate locate apc.php
/usr/share/doc/php5-apcu/apc.php
cp /usr/share/doc/php5-apcu/apc.php /var/www/localhost/
Edit /etc/nginx/sites-available/localhost and add:
        location ~ /apc\.php$ {
                fastcgi_pass unix:/var/run/php5-fpm.sock;
                fastcgi_param SCRIPT_FILENAME $document_root$fastcgi_script_name;
                fastcgi_intercept_errors on;
                include fastcgi_params;
                access_log off;
                allow 127.0.0.1;
                deny all;
        }
Restart Nginx and then:
lynx -dump http://localhost/apc.php
   [1]APCu
   User Cache
   [2]Login
     __________________________________________________________________

    1. [3]Refresh Data
    2. View Host Stats
    3. [4]User Cache Entries
    4. [5]Version Check

General Cache Information

   APCu Version        4.0.7
   PHP Version         5.6.9-0+deb8u1
   APCu Host           localhost (crin2.crin.org) (127.0.0.1)
   Server Software     nginx/1.6.2
   Shared Memory       1 Segment(s) with 128.0 MBytes
                       (mmap memory)
   Start Time          2015/06/15 11:00:09
   Uptime              42 minutes
   File Upload Support 1

Cache Information

   Cached Variables            0 ( 0.0 Bytes)
   Hits                        0
   Misses                      0
   Request Rate (hits, misses) 0.00 cache requests/second
   Hit Rate                    0.00 cache requests/second
   Miss Rate                   0.00 cache requests/second
   Insert Rate                 0.00 cache requests/second
   Cache full count            0

Runtime Settings

   apc.coredump_unmap   0
   apc.enable_cli       1
   apc.enabled          1
   apc.entries_hint     4096
   apc.gc_ttl           3600
   apc.mmap_file_mask
   apc.preload_path
   apc.rfc1867          0
   apc.rfc1867_freq     0
   apc.rfc1867_name     APC_UPLOAD_PROGRESS
   apc.rfc1867_prefix   upload_
   apc.rfc1867_ttl      3600
   apc.serializer       php
   apc.shm_segments     1
   apc.shm_size         128M
   apc.slam_defense     1
   apc.smart            0
   apc.ttl              0
   apc.use_request_time 1
   apc.writable         /tmp

Host Status Diagrams

   Memory Usage                 Hits & Misses
    Free: 128.0 MBytes (100.0%)  Hits: 0 (0.0%)
    Used: 32.2 KBytes (0.0%)     Misses: 0 (0.0%)

Detailed Memory Usage and Fragmentation

   Fragmentation: 0%

References

   1. http://pecl.php.net/package/APCu
   2. http://localhost/apc.php
   3. http://localhost/apc.php?SCOPE=A&SORT1=H&SORT2=D&COUNT=20&OB=1&SH=
   4. http://localhost/apc.php?SCOPE=A&SORT1=H&SORT2=D&COUNT=20&OB=2
   5. http://localhost/apc.php?SCOPE=A&SORT1=H&SORT2=D&COUNT=20&OB=3
Still don't understand why APC isn't being used.
Have spent some time watching the logs and have changed these settings as a result, in /etc/php5/fpm/php.ini:
memory_limit = 384M
And in /etc/php5/fpm/pool.d/www.conf:
pm.max_children = 50

pm.start_servers = 3

pm.min_spare_servers = 2

pm.max_spare_servers = 6
Things seem to be running better now... but more needs to be done to optimise the servers...
comment:11 Changed 3 years ago by chris
- Add Hours to Ticket changed from 0 to 0.68
- Total Hours changed from 3.83 to 4.51
Spend some time trying to track down why APC isn't working, still no joy, the latest results from the stats script:
lynx -dump http://localhost/apc.php
   [1]APCu
   User Cache
   [2]Login
     __________________________________________________________________

    1. [3]Refresh Data
    2. View Host Stats
    3. [4]User Cache Entries
    4. [5]Version Check

General Cache Information

   APCu Version        4.0.7
   PHP Version         5.6.9-0+deb8u1
   APCu Host           localhost (crin2.crin.org) (127.0.0.1)
   Server Software     nginx/1.6.2
   Shared Memory       1 Segment(s) with 256.0 MBytes
                       (mmap memory)
   Start Time          2015/06/15 13:24:52
   Uptime              13 minutes
   File Upload Support 1

Cache Information

   Cached Variables            0 ( 0.0 Bytes)
   Hits                        0
   Misses                      0
   Request Rate (hits, misses) 0.00 cache requests/second
   Hit Rate                    0.00 cache requests/second
   Miss Rate                   0.00 cache requests/second
   Insert Rate                 0.00 cache requests/second
   Cache full count            0

Runtime Settings

   apc.coredump_unmap   0
   apc.enable_cli       1
   apc.enabled          1
   apc.entries_hint     4096
   apc.gc_ttl           3600
   apc.mmap_file_mask   /dev/shm/apc.7ByvRj
   apc.preload_path
   apc.rfc1867          0
   apc.rfc1867_freq     0
   apc.rfc1867_name     APC_UPLOAD_PROGRESS
   apc.rfc1867_prefix   upload_
   apc.rfc1867_ttl      3600
   apc.serializer       php
   apc.shm_segments     1
   apc.shm_size         256M
   apc.slam_defense     1
   apc.smart            0
   apc.ttl              3600
   apc.use_request_time 1
   apc.writable         /tmp

Host Status Diagrams

   Memory Usage                 Hits & Misses
    Free: 256.0 MBytes (100.0%)  Hits: 0 (0.0%)
    Used: 32.2 KBytes (0.0%)     Misses: 0 (0.0%)

Detailed Memory Usage and Fragmentation

   Fragmentation: 0%

References

   1. http://pecl.php.net/package/APCu
   2. http://localhost/apc.php
   3. http://localhost/apc.php?SCOPE=A&SORT1=H&SORT2=D&COUNT=20&OB=1&SH=
   4. http://localhost/apc.php?SCOPE=A&SORT1=H&SORT2=D&COUNT=20&OB=2
   5. http://localhost/apc.php?SCOPE=A&SORT1=H&SORT2=D&COUNT=20&OB=3
comment:12 Changed 3 years ago by chris
- Add Hours to Ticket changed from 0 to 0.38
- Total Hours changed from 4.51 to 4.89
Perhaps the Drupal APC modules is needed for APC to cache things (though I have used APC on other servers with applications that don't have any APC specific code), in any case I think I have spent enough time trying to get it working -- the site will have to live without it for now (I don't think it was working on the GreenCloud servers either but there we had twice as much RAM).
So disablng the config:
cd /etc/php5/fpm/conf.d/
rm 20-apcu.ini
cd cd /etc/munin/plugins
rm php_apc_*
aptitude remove php5-apcu
service php5-fpm restart
service munin-node restart
The server does have a lot more memory allocated to memcache that the previous server see the Munin stats (the units used are KiB, 1 kibibyte is 1024 bytes, so the current usage of 1400000 KiB equates to 170MB) -- 512MB has been made available compared with 64MB -- so this should help, especially as more things are cached.
comment:13 Changed 3 years ago by chris
- Add Hours to Ticket changed from 0 to 0.21
- Total Hours changed from 4.89 to 5.1
Checking the MySQL memory allocation on Crin2:
mysqltuner

 >>  MySQLTuner 1.3.0 - Major Hayden <major@mhtx.net>
 >>  Bug reports, feature requests, and downloads at http://mysqltuner.com/
 >>  Run with '--help' for additional options and output filtering
[OK] Logged in using credentials from debian maintenance account.
[OK] Currently running supported MySQL version 5.5.43-0+deb8u1
[OK] Operating on 64-bit architecture

-------- Storage Engine Statistics -------------------------------------------
[--] Status: +ARCHIVE +BLACKHOLE +CSV -FEDERATED +InnoDB +MRG_MYISAM
[--] Data in InnoDB tables: 820M (Tables: 512)
[--] Data in MyISAM tables: 1G (Tables: 79)
[--] Data in PERFORMANCE_SCHEMA tables: 0B (Tables: 17)
[--] Data in MEMORY tables: 0B (Tables: 1)
[!!] Total fragmented tables: 528

-------- Security Recommendations  -------------------------------------------
[OK] All database users have passwords assigned

-------- Performance Metrics -------------------------------------------------
[--] Up for: 33d 2h 14m 57s (63M q [22.092 qps], 499K conn, TX: 700B, RX: 23B)
[--] Reads / Writes: 87% / 13%
[--] Total buffers: 1.1G global + 2.7M per thread (151 max threads)
[OK] Maximum possible memory usage: 1.5G (38% of installed RAM)
[OK] Slow queries: 0% (209/63M)
[OK] Highest usage of available connections: 35% (54/151)
[OK] Key buffer size / total MyISAM indexes: 16.0M/241.6M
[OK] Key buffer hit rate: 99.9% (5B cached / 6M reads)
[OK] Query cache efficiency: 90.0% (54M cached / 60M selects)
[!!] Query cache prunes per day: 124076
[OK] Sorts requiring temporary tables: 0% (6K temp sorts / 1M sorts)
[OK] Temporary tables created on disk: 6% (40K on disk / 657K total)
[OK] Thread cache hit rate: 99% (2K created / 499K connections)
[!!] Table cache hit rate: 0% (400 open / 85K opened)
[OK] Open file limit used: 16% (167/1K)
[OK] Table locks acquired immediately: 99% (8M immediate / 8M locks)
[OK] InnoDB buffer pool / data size: 1.0G/820.9M
[OK] InnoDB log waits: 0
-------- Recommendations -----------------------------------------------------
General recommendations:
    Run OPTIMIZE TABLE to defragment tables for better performance
    Enable the slow query log to troubleshoot bad queries
    Increase table_open_cache gradually to avoid file descriptor limits
    Read this before increasing table_open_cache over 64: http://bit.ly/1mi7c4C
Variables to adjust:
    query_cache_size (> 32M)
    table_open_cache (> 400)
Based on the above I have doubles the size of the query_cache_size (from 32M to 64M) and also changed the directory where temp files are created from /tmp to /dev/shm (which is RAM rather than disk):
#tmpdir         = /tmp
tmpdir          = /dev/shm

#query_cache_size        = 32M
query_cache_size        = 64M
This should speed things up a bit, I'll check the results later this week, MySQL was restarted.
comment:14 follow-up: ↓ 15 Changed 3 years ago by chris
- Add Hours to Ticket changed from 0 to 0.43
- Total Hours changed from 5.1 to 5.53
When the web server, Nginx, can't connect to the PHP processor, php-fpm, users get 502/503/504 errors, this is bad and it was an issue when the GreenQloud servers were first set up and I'm concerned that it might be an issue now, with the new servers.
On the GreenQloud server the /etc/logrotate.d/nginx config was amended from the default to add a check for errors each night:
/var/log/nginx/*.log {
        daily
        missingok
        rotate 52
        compress
        delaycompress
        notifempty
        create 0640 www-data adm
        sharedscripts
        prerotate
                /usr/local/sbin/nginx-logwatch root@localhost
                if [ -d /etc/logrotate.d/httpd-prerotate ]; then \
                        run-parts /etc/logrotate.d/httpd-prerotate; \
                fi; \
        endscript
        postrotate
                [ ! -f /var/run/nginx.pid ] || kill -USR1 `cat /var/run/nginx.pid`
        endscript
}
The /usr/local/sbin/nginx-logwatch script contained:
#!/bin/bash

# The log file we are checking, best run the script via logrotate,
# for example edit /etc/logrotate.d/nginx to:
#
#   prerotate
#          /usr/local/bin/nginx-logwatch chris@webarchitects.co.uk
#          if [ -d /etc/logrotate.d/httpd-prerotate ]; then \
#                  run-parts /etc/logrotate.d/httpd-prerotate; \
#          fi \
#   endscript
LOGFILE="/var/log/nginx/crin.org.access.log"

# Optional email address to send the results to
EMAIL=$1

# check that the script is being run by root
if [[ "$(id -u)" != "0" ]] ; then
  echo "You must run $0 as root or via sudo"
  exit 2
fi

# grep for all the lines with error codes
#ERRORS=$(grep '1.[0|1]" [4|5]0[2|3|4] ' $LOGFILE)
#ERRORS=$(grep '1.[0|1]" [4|5]0[2|3|4] ' $LOGFILE)
ERRORS=$(grep '1.[0|1]" 50[2|3|4] ' $LOGFILE)
# grep for to totals for these errors codes
#ERRORS_403=$(grep -c '1.[0|1]" 403 ' $LOGFILE)
#ERRORS_404=$(grep -c '1.[0|1]" 404 ' $LOGFILE)
ERRORS_502=$(grep -c '1.[0|1]" 502 ' $LOGFILE)
ERRORS_503=$(grep -c '1.[0|1]" 503 ' $LOGFILE)
ERRORS_504=$(grep -c '1.[0|1]" 504 ' $LOGFILE)

# check to see if any errors were found
if [[ $ERRORS ]]; then
  # check for a email address
  if [[ $EMAIL ]]; then
    # name of the server
    HOSTNAME=$(hostname)
    # email subject line
    #SUBJECT="$ERRORS_403 403, $ERRORS_404 404, $ERRORS_502 502, $ERRORS_503 503 and $ERRORS_504 504 errors from $HOSTNAME"
    #SUBJECT="$ERRORS_403 403, $ERRORS_502 502, $ERRORS_503 503 and $ERRORS_504 504 errors from $HOSTNAME"
    SUBJECT="$ERRORS_502 502, $ERRORS_503 503 and $ERRORS_504 504 errors from $HOSTNAME"
    # we were supplied with a email address so send the results by email using mutt
    echo "$ERRORS" | mutt -s "$SUBJECT" $EMAIL
  # we don't have a email address so display the results of the grep
  else [[ ! $EMAIL ]]
    echo "Supply a email address on the command line to send the following results by email"
    echo ""
    #echo "Total 403 errors: $ERRORS_403"
    #echo "Total 404 errors: $ERRORS_404"
    echo "Total 502 errors: $ERRORS_502"
    echo "Total 503 errors: $ERRORS_503"
    echo "Total 504 errors: $ERRORS_504"
    echo ""
    echo "Lines with errors from $LOGFILE"
    echo ""
    echo "$ERRORS"
    echo ""
    echo "This script is best piped into a pager, eg:"
    echo "$0 | less"
  fi
else
   # we don't want any output if a email address is specified as the script is run via cron
   if [[ ! $EMAIL ]] ; then
     #echo "No recent 403, 404, 502, 503 or 504 errors were found"
     #echo "No recent 403, 502, 503 or 504 errors were found"
     echo "No recent 502, 503 or 504 errors were found"
   fi
fi
The above script is a bit of a cludge, it only checks the HTTP access log and not the HTTPS access log for starters, so I have changed that and run it on the HTTP log and got these totals:
Total 502 errors: 1351
Total 503 errors: 0
Total 504 errors: 0
And on the HTTPS log:
Total 502 errors: 793
Total 503 errors: 0
Total 504 errors: 0
So there is clearly a problem here.
I have posted the script to wiki:NginxLogWatch.
I have edited the /etc/logrotate.d/nginx config file:
/var/log/nginx/*.log {
        weekly
        missingok
        rotate 52
        compress
        delaycompress
        notifempty
        create 0640 www-data adm
        sharedscripts
        prerotate
                /usr/local/bin/nginx-logwatch /var/log/nginx/crin.org.ssl_access.log root@localhost
                /usr/local/bin/nginx-logwatch /var/log/nginx/crin.org.access.log root@localhost
                if [ -d /etc/logrotate.d/httpd-prerotate ]; then \
                        run-parts /etc/logrotate.d/httpd-prerotate; \
                fi \
        endscript
        postrotate
                invoke-rc.d nginx rotate >/dev/null 2>&1
        endscript
}
So now we should get a two daily emails with the totals and this should help track down the issue.
comment:15 in reply to: ↑ 14 Changed 3 years ago by chris
- Add Hours to Ticket changed from 0 to 0.32
- Total Hours changed from 5.53 to 5.85
Replying to chris:
So now we should get a two daily emails with the totals and this should help track down the issue.
Yesterday I missed that the logrotation is set to happen weekly, so I have edited /etc/logrotate.d/nginx and changed weekly to daily.
Checking on the 50x errors since yesterday:
/usr/local/bin/nginx-logwatch /var/log/nginx/crin.org.access.log | less

Total 502 errors: 1522
Total 503 errors: 0
Total 504 errors: 0
The last error was at 16/Jun/2015:14:18:25.
/usr/local/bin/nginx-logwatch /var/log/nginx/crin.org.ssl_access.log | less

Total 502 errors: 816
Total 503 errors: 0
Total 504 errors: 0
The last error was at 16/Jun/2015:14:18:17.
So this problem looks like it has already been solved.
Checking on the Crin1 MySQL stats:
mysqltuner

 >>  MySQLTuner 1.3.0 - Major Hayden <major@mhtx.net>
 >>  Bug reports, feature requests, and downloads at http://mysqltuner.com/
 >>  Run with '--help' for additional options and output filtering
[OK] Logged in using credentials from debian maintenance account.
[OK] Currently running supported MySQL version 5.5.43-0+deb8u1
[OK] Operating on 64-bit architecture

-------- Storage Engine Statistics -------------------------------------------
[--] Status: +ARCHIVE +BLACKHOLE +CSV -FEDERATED +InnoDB +MRG_MYISAM
[--] Data in PERFORMANCE_SCHEMA tables: 0B (Tables: 17)
[--] Data in InnoDB tables: 839M (Tables: 512)
[--] Data in MEMORY tables: 0B (Tables: 1)
[--] Data in MyISAM tables: 1G (Tables: 79)
[!!] Total fragmented tables: 524

-------- Security Recommendations  -------------------------------------------
[OK] All database users have passwords assigned

-------- Performance Metrics -------------------------------------------------
[--] Up for: 21h 32m 44s (10M q [140.211 qps], 74K conn, TX: 124B, RX: 3B)
[--] Reads / Writes: 88% / 12%
[--] Total buffers: 1.1G global + 2.7M per thread (151 max threads)
[OK] Maximum possible memory usage: 1.5G (38% of installed RAM)
[OK] Slow queries: 0% (39/10M)
[OK] Highest usage of available connections: 35% (53/151)
[OK] Key buffer size / total MyISAM indexes: 16.0M/241.7M
[OK] Key buffer hit rate: 99.9% (1B cached / 1M reads)
[OK] Query cache efficiency: 91.7% (9M cached / 10M selects)
[!!] Query cache prunes per day: 510672
[OK] Sorts requiring temporary tables: 0% (1K temp sorts / 276K sorts)
[OK] Temporary tables created on disk: 4% (4K on disk / 99K total)
[OK] Thread cache hit rate: 97% (1K created / 74K connections)
[!!] Table cache hit rate: 2% (400 open / 17K opened)
[OK] Open file limit used: 14% (153/1K)
[OK] Table locks acquired immediately: 99% (1M immediate / 1M locks)
[OK] InnoDB buffer pool / data size: 1.0G/839.8M
[OK] InnoDB log waits: 0
-------- Recommendations -----------------------------------------------------
General recommendations:
    Run OPTIMIZE TABLE to defragment tables for better performance
    MySQL started within last 24 hours - recommendations may be inaccurate
    Enable the slow query log to troubleshoot bad queries
    Increase table_open_cache gradually to avoid file descriptor limits
    Read this before increasing table_open_cache over 64: http://bit.ly/1mi7c4C
Variables to adjust:
    query_cache_size (> 64M)
    table_open_cache (> 400)
I have read the document at http://bit.ly/1mi7c4C and note that the MySQL databases have a total of 609 tables so I have doubled the table_open_cache from the default of 400 and also increased the query_cache_size:
table_open_cache        = 800

query_cache_size        = 128M
And that might be good enough, in the last 21 hours there have been 10 million MySQL queries and 39 of them were slow, the default value for slow is over 1 second. The slow and long log has also been uncommented so we can check what these are if needs be:
slow_query_log_file = /var/log/mysql/mysql-slow.log
slow_query_log      = 1
long_query_time = 2
log_queries_not_using_indexes
Changed 3 years ago by chris
comment:16 Changed 3 years ago by chris
- Add Hours to Ticket changed from 0 to 0.5
- Total Hours changed from 5.85 to 6.35
I have realised why I couldn't get APC to work (it was removed yesterday, see ticket:9#comment:12) -- it is because PHP 5.5 comes with Zend Opcache:
Because OPcache is designed to replace the APC module, it is not possible to run them in parallel in PHP.
These were the Zend OPcache default settings:
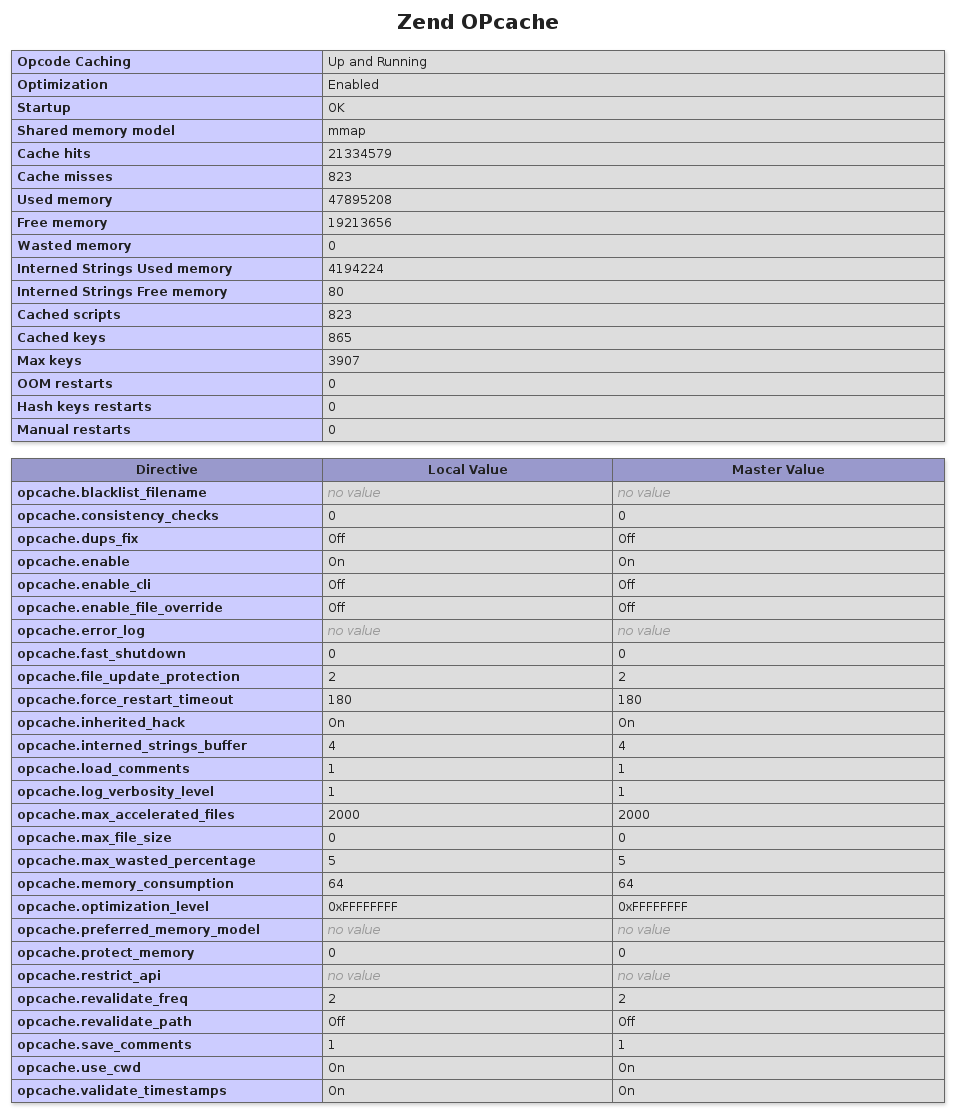
And these values were changed in /etc/php5/fpm/php.ini:
;opcache.enable=0
opcache.enable=1

;opcache.memory_consumption=64
opcache.memory_consumption=256

;opcache.interned_strings_buffer=4
opcache.interned_strings_buffer=12

;opcache.max_accelerated_files=2000
opcache.max_accelerated_files=10000

opcache.validate_timestamps=1

;opcache.revalidate_freq=2
opcache.revalidate_freq=240

;opcache.error_log=
opcache.error_log=/var/log/php5-opcache.log
Create logfile and restart:
touch /var/log/php5-opcache.log
chown www-data:www-data /var/log/php5-opcache.log
service php5-fpm restart
In order to get some Munin stats for opcache, this plugin was installed:
wget https://github.com/unreal4u/munin_opcache/archive/master.zip -O munin_opcache.zip
unzip munin_opcache.zip
cp munin_opcache-master/src/scripts/*.php /var/www/localhost/
cp munin_opcache-master/src/plugins/* /usr/local/share/munin/plugins/
cd /etc/munin/plugins/
ln -s /usr/local/share/munin/plugins/php_opcache_memoryusage
ln -s /usr/local/share/munin/plugins/php_opcache_restarts
Nigix config added to /etc/nginx/sites-available/localhost:
        location ~ /munin_opcache\.php$ {
                fastcgi_pass unix:/var/run/php5-fpm.sock;
                fastcgi_param SCRIPT_FILENAME $document_root$fastcgi_script_name;
                fastcgi_intercept_errors on;
                include fastcgi_params;
                access_log off;
                allow 127.0.0.1;
                deny all;
        }
        location ~ /opc\.php$ {
                fastcgi_pass unix:/var/run/php5-fpm.sock;
                fastcgi_param SCRIPT_FILENAME $document_root$fastcgi_script_name;
                fastcgi_intercept_errors on;
                include fastcgi_params;
                access_log off;
                allow 127.0.0.1;
                deny all;
        }
Munin config added to /etc/munin/plugin-conf.d/munin-node:
[php_opcache_*]
env.URL http://localhost/munin_opcache.php
Restart Nginx and munin-node and test the munin plugins on the command line:
cd /etc/munin/plugins
munin-run php_opcache_memoryusage
mem_used.value 49809568
mem_free.value 218625888
mem_wasted.value 0
oom_restarts.value 0
hash_restarts.value 0
manual_restarts.value 0
in-run php_opcache_memoryusage
mem_used.value 49809568
mem_free.value 218625888
mem_wasted.value 0
oom_restarts.value 0
hash_restarts.value 0
manual_restarts.value 0
So in a while we should get some opcache munin stats and with compiled php being cached for 5 mins the site should be faster.
Changed 3 years ago by chris
comment:17 Changed 3 years ago by chris
- Add Hours to Ticket changed from 0 to 1.1
- Total Hours changed from 6.35 to 7.45
Reading this document on opcache and checking the status:
lynx -dump http://localhost/opc.php | less

   memory
   256M
       207M 81% free
       49M  18% used
       0        wasted
   keys
   16K
      15K 96% free
      565 3%  scripts
      17      wasted
   hits
   759K
       759K 99% hits
       634      misses
       0        blacklist
   restarts
   0
    0 manual
    0 keys
    0 memory

general

   Host            crin2.crin.org
   PHP Version     PHP 5.6.9-0+deb8u1 fpm-fcgi Linux
   Opcache Version Zend OPcache 7.0.4-dev
   Opcode Caching      Up and Running
   Optimization        Enabled
   Startup             OK
   Shared memory model mmap
   Uptime 49 minutes and 20 seconds

memory

   Used Memory               48.5M
   Free Memory               207.5M
   Wasted Memory             0
   Current Wasted Percentage 0

statistics

   Num Cached Scripts   565
   Num Cached Keys      582
   Max Cached Keys      16229
   Hits                 758616
   Oom Restarts         0
   Hash Restarts        0
   Manual Restarts      0
   Misses               634
   Blacklist Misses     0
   Blacklist Miss Ratio 0
   Opcache Hit Rate     99.9
The amount of memory allocated to opcache can be reduced by the looks of it (49M is used, 18%) and as long as php-fpm is restarted after any new code is deployed the file date checks can also be turned off, so these variables in /etc/php5/fpm/php.ini were changed:
;opcache.memory_consumption=256
opcache.memory_consumption=96

;opcache.interned_strings_buffer=12
opcache.interned_strings_buffer=8

;opcache.max_accelerated_files=10000
opcache.max_accelerated_files=2000

;opcache.validate_timestamps=1
opcache.validate_timestamps=0

;opcache.save_comments=1
opcache.save_comments=0

;opcache.log_verbosity_level=1
opcache.log_verbosity_level=3
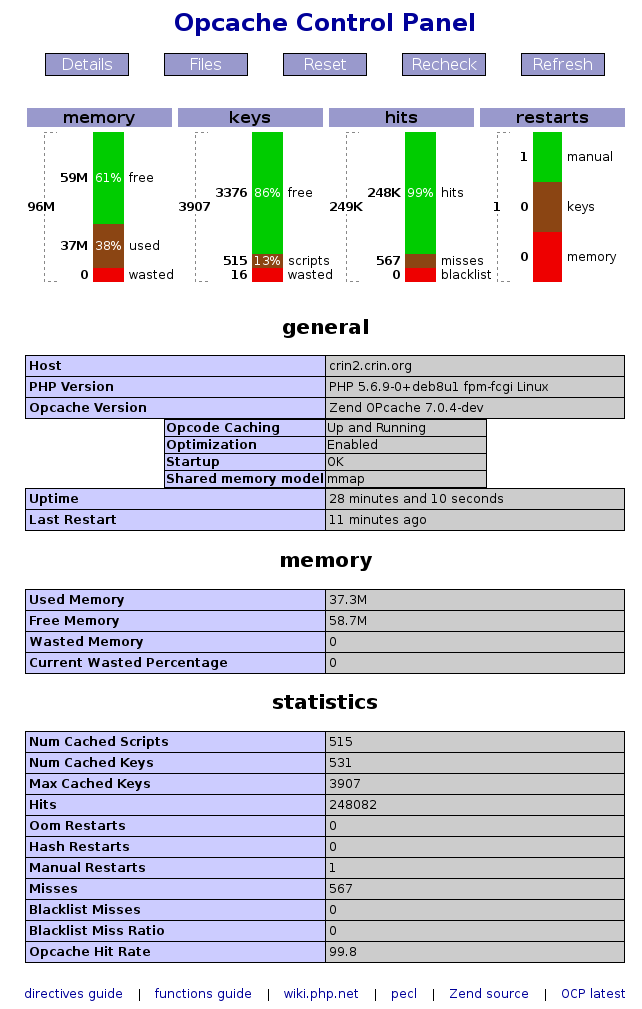
After a restart it now looks like this:
lynx -dump http://localhost/opc.php | less

   memory
   96M
      58M 60% free
      38M 39% used
      0       wasted
   keys
   3907
       3370 86% free
       520  13% scripts
       17       wasted
   hits
   148K
       148K 99% hits
       568      misses
       0        blacklist
   restarts
   0
    0 manual
    0 keys
    0 memory

general

   Host            crin2.crin.org
   PHP Version     PHP 5.6.9-0+deb8u1 fpm-fcgi Linux
   Opcache Version Zend OPcache 7.0.4-dev
   Opcode Caching      Up and Running
   Optimization        Enabled
   Startup             OK
   Shared memory model mmap
   Uptime 9 minutes and 34 seconds

memory

   Used Memory               37.7M
   Free Memory               58.3M
   Wasted Memory             0
   Current Wasted Percentage 0

statistics

   Num Cached Scripts   520
   Num Cached Keys      537
   Max Cached Keys      3907
   Hits                 147750
   Oom Restarts         0
   Hash Restarts        0
   Manual Restarts      0
   Misses               568
   Blacklist Misses     0
   Blacklist Miss Ratio 0
   Opcache Hit Rate     99.6
You can also get a graphical version of the above via a ssh tunnel to the server.
The files stats are also interesting, you can sort files by size, hits and last acceess time.
I don't think there is much more that can be done to optimise this for now, the sites still doesn't seem that fast, testing with http://tools.pingdom.com/fpt/ it is still taking 4-5 seconds for the front page to load which isn't ideal.
But I can't think of any else to tweak for now, it would be worth checking how things look in a few days.
comment:18 Changed 3 years ago by chris
It is perhaps worth noting that the front page loads:
- 37 images
- 32 style sheets
- 14 Javascript files
A lot of the Javascript files and CSS files could potentially be compressed into a small number using a Drupal modules such as Minify.
The total size of the front page is 2MB and 91 files are served to generate it.
comment:19 Changed 3 years ago by chris
- Add Hours to Ticket changed from 0 to 0.37
- Total Hours changed from 7.45 to 7.82
Looking at the MySQL query cache and also the slow query log graph and the /var/log/mysql/mysql-slow.log a selection of the slow queries (ones over 2 seconds):
SELECT * FROM languages ORDER BY weight ASC, name ASC;
# Time: 150617 10:28:30
# User@Host: drupal[drupal] @ crin2 [93.95.228.180]
# Query_time: 2.122526  Lock_time: 0.000098 Rows_sent: 1  Rows_examined: 1

SELECT domain_id, alias_id, pattern, redirect FROM domain_alias;
# Time: 150617 10:28:31
# User@Host: drupal[drupal] @ crin2 [93.95.228.180]
# Query_time: 2.031516  Lock_time: 0.000051 Rows_sent: 1  Rows_examined: 1

SELECT 1 FROM quicktabs LIMIT 0, 1;
# User@Host: drupal[drupal] @ crin2 [93.95.228.180]
# Query_time: 2.950658  Lock_time: 0.000179 Rows_sent: 1  Rows_examined: 1

SELECT p.language, p.path FROM i18n_path p INNER JOIN i18n_path ps ON p.tsid = ps.tsid WHERE ps.path = 'taxonomy/term/226';
# Time: 150617 10:28:44
# User@Host: drupal[drupal] @ crin2 [93.95.228.180]
# Query_time: 2.614113  Lock_time: 0.000036 Rows_sent: 1  Rows_examined: 1

SET timestamp=1434536940;
SELECT node.title AS node_title, node.nid AS nid, node.language AS node_language, menu_links.weight AS menu_links_weight, node.created AS node_created, 'menu_children:block' AS view_name
FROM
node node
LEFT JOIN menu_node menu_node ON node.nid = menu_node.nid
LEFT JOIN menu_links menu_links ON menu_node.mlid = menu_links.mlid
WHERE (( (menu_links.plid = '2944' ) )AND(( (node.status = '1') )))AND ( EXISTS  (SELECT na.nid AS nid
FROM
node_access na
WHERE (( (na.gid = '0') AND (na.realm = 'all') )OR( (na.gid = '0') AND (na.realm = 'domain_site') )OR( (na.gid = '1') AND (na.realm = 'domain_id') ))AND (na.grant_view >= '1') AND (node.nid = na.nid) ))
ORDER BY menu_links_weight ASC, node_created DESC;
# User@Host: drupal[drupal] @ crin2 [93.95.228.180]
# Query_time: 3.420401  Lock_time: 0.000049 Rows_sent: 1  Rows_examined: 1

SELECT node.title AS node_title, node.nid AS nid, node.language AS node_language, menu_links.weight AS menu_links_weight, node.created AS node_created, 'menu_children:block' AS view_name
FROM
node node
LEFT JOIN menu_node menu_node ON node.nid = menu_node.nid
LEFT JOIN menu_links menu_links ON menu_node.mlid = menu_links.mlid
WHERE (( (menu_links.plid = '3355' ) )AND(( (node.status = '1') )))AND ( EXISTS  (SELECT na.nid AS nid
FROM
node_access na
WHERE (( (na.gid = '0') AND (na.realm = 'all') )OR( (na.gid = '0') AND (na.realm = 'domain_site') )OR( (na.gid = '1') AND (na.realm = 'domain_id') ))AND (na.grant_view >= '1') AND (node.nid = na.nid) ))
ORDER BY menu_links_weight ASC, node_created DESC;
# Time: 150617 10:29:10
# User@Host: drupal[drupal] @ crin2 [93.95.228.180]
# Query_time: 2.497067  Lock_time: 0.000052 Rows_sent: 1  Rows_examined: 1

SELECT p.language, p.path FROM i18n_path p INNER JOIN i18n_path ps ON p.tsid = ps.tsid WHERE ps.path = 'library/organisations/news/695';
# User@Host: drupal[drupal] @ crin2 [93.95.228.180]
# Query_time: 3.127029  Lock_time: 0.000058 Rows_sent: 1  Rows_examined: 1

SELECT cid, data, created, expire, serialized FROM cache_bootstrap WHERE cid IN ('variables');
# Time: 150617 10:29:51
# User@Host: drupal[drupal] @ crin2 [93.95.228.180]
# Query_time: 2.688887  Lock_time: 0.000033 Rows_sent: 1  Rows_examined: 1

SET timestamp=1434536992;
SELECT p.language, p.path FROM i18n_path p INNER JOIN i18n_path ps ON p.tsid = ps.tsid WHERE ps.path = 'node/6797';
# User@Host: drupal[drupal] @ crin2 [93.95.228.180]
# Query_time: 3.167818  Lock_time: 0.000051 Rows_sent: 1  Rows_examined: 1
Checking for numbers of slow queries by time:
grep "Query_time: 1\." /var/log/mysql/mysql-slow.log | wc -l
91
grep "Query_time: 2\." /var/log/mysql/mysql-slow.log | wc -l
6780
grep "Query_time: 3\." /var/log/mysql/mysql-slow.log | wc -l
3113
grep "Query_time: 4\." /var/log/mysql/mysql-slow.log | wc -l
1399
grep "Query_time: 5\." /var/log/mysql/mysql-slow.log | wc -l
697
grep "Query_time: 6\." /var/log/mysql/mysql-slow.log | wc -l
432
grep "Query_time: 7\." /var/log/mysql/mysql-slow.log | wc -l
278
grep "Query_time: 8\." /var/log/mysql/mysql-slow.log | wc -l
232
grep "Query_time: 9\." /var/log/mysql/mysql-slow.log | wc -l
161
grep "Query_time: 10\." /var/log/mysql/mysql-slow.log | wc -l
116
grep "Query_time: 11\." /var/log/mysql/mysql-slow.log | wc -l
95
grep "Query_time: 12\." /var/log/mysql/mysql-slow.log | wc -l
82
grep "Query_time: 13\." /var/log/mysql/mysql-slow.log | wc -l
55
grep "Query_time: 14\." /var/log/mysql/mysql-slow.log | wc -l
52
grep "Query_time: 15\." /var/log/mysql/mysql-slow.log | wc -l
22
grep "Query_time: 16\." /var/log/mysql/mysql-slow.log | wc -l
31
grep "Query_time: 1[0-9]\." /var/log/mysql/mysql-slow.log | wc -l
489
grep "Query_time: 2[0-9]\." /var/log/mysql/mysql-slow.log | wc -l
15
grep "Query_time: 3[0-9]\." /var/log/mysql/mysql-slow.log | wc -l
0
grep "Query_time: [0-9]\." /var/log/mysql/mysql-slow.log | wc -l
28274
grep "Query_time: [2-9]\." /var/log/mysql/mysql-slow.log | wc -l
13297
grep "Query_time: 0\." /var/log/mysql/mysql-slow.log | wc -l
14933
So the above shows that since the slowlog was enabled there have been 15 queries that took over 20 seconds but less than 30 (none took 30 or more seconds), alomst 500 queries took between 10 and 20 seconds, 13k queries took between 2 and 9 seconds, so based on this and the mysqltuner report:
mysqltuner

 >>  MySQLTuner 1.3.0 - Major Hayden <major@mhtx.net>
 >>  Bug reports, feature requests, and downloads at http://mysqltuner.com/
 >>  Run with '--help' for additional options and output filtering
[OK] Logged in using credentials from debian maintenance account.
[OK] Currently running supported MySQL version 5.5.43-0+deb8u1-log
[OK] Operating on 64-bit architecture

-------- Storage Engine Statistics -------------------------------------------
[--] Status: +ARCHIVE +BLACKHOLE +CSV -FEDERATED +InnoDB +MRG_MYISAM
[--] Data in MEMORY tables: 0B (Tables: 1)
[--] Data in MyISAM tables: 1G (Tables: 79)
[--] Data in PERFORMANCE_SCHEMA tables: 0B (Tables: 17)
[--] Data in InnoDB tables: 839M (Tables: 512)
[!!] Total fragmented tables: 524

-------- Security Recommendations  -------------------------------------------
[OK] All database users have passwords assigned

-------- Performance Metrics -------------------------------------------------
[--] Up for: 5h 37m 48s (3M q [191.998 qps], 26K conn, TX: 46B, RX: 1B)
[--] Reads / Writes: 85% / 15%
[--] Total buffers: 1.2G global + 2.7M per thread (151 max threads)
[OK] Maximum possible memory usage: 1.6G (40% of installed RAM)
[OK] Slow queries: 0% (28K/3M)
[OK] Highest usage of available connections: 33% (51/151)
[OK] Key buffer size / total MyISAM indexes: 16.0M/241.8M
[OK] Key buffer hit rate: 99.9% (387M cached / 483K reads)
[OK] Query cache efficiency: 91.8% (3M cached / 3M selects)
[!!] Query cache prunes per day: 136416
[OK] Sorts requiring temporary tables: 0% (491 temp sorts / 98K sorts)
[OK] Temporary tables created on disk: 1% (803 on disk / 44K total)
[OK] Thread cache hit rate: 94% (1K created / 26K connections)
[OK] Table cache hit rate: 30% (800 open / 2K opened)
[OK] Open file limit used: 18% (317/1K)
[OK] Table locks acquired immediately: 99% (444K immediate / 444K locks)
[OK] InnoDB buffer pool / data size: 1.0G/839.8M
[OK] InnoDB log waits: 0
-------- Recommendations -----------------------------------------------------
General recommendations:
    Run OPTIMIZE TABLE to defragment tables for better performance
    MySQL started within last 24 hours - recommendations may be inaccurate
Variables to adjust:
    query_cache_size (> 128M)
These variables in /etc/mysql/my.cnf were edited:
#query_cache_size        = 128M
query_cache_size        = 256M

#log_queries_not_using_indexes
This will result in only things that take more than two seconds being logged and queries not using indexes won't be logged.
Changed 3 years ago by chris
Changed 3 years ago by chris
Changed 3 years ago by chris
comment:20 Changed 3 years ago by chris
- Add Hours to Ticket changed from 0 to 0.2
- Total Hours changed from 7.82 to 8.02
Looking at the MySQL Munin graphs, the query cache hit it's limit in the early hours:
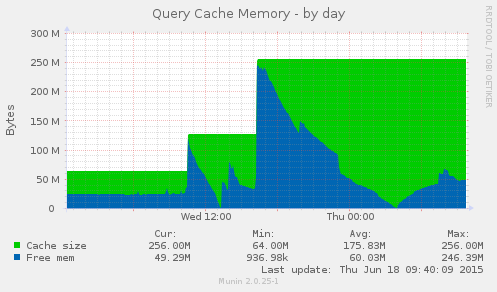
And there also appears to be a correlation between the number of slow queries and the size of the query cache:
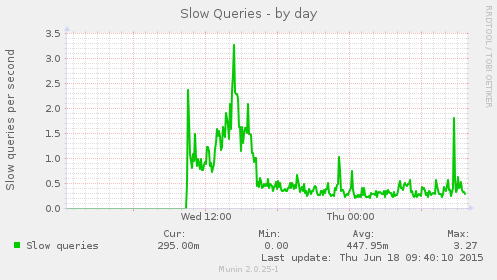
Also note that the increased in the query cache size haven't made a significant impact on the overall MySQL memory footprint:
So I think it would make sense to double the size of the query cache again.
The latest output from mysqltuner:
 >>  MySQLTuner 1.3.0 - Major Hayden <major@mhtx.net>
 >>  Bug reports, feature requests, and downloads at http://mysqltuner.com/
 >>  Run with '--help' for additional options and output filtering
[OK] Logged in using credentials from debian maintenance account.
[OK] Currently running supported MySQL version 5.5.43-0+deb8u1-log
[OK] Operating on 64-bit architecture

-------- Storage Engine Statistics -------------------------------------------
[--] Status: +ARCHIVE +BLACKHOLE +CSV -FEDERATED +InnoDB +MRG_MYISAM
[--] Data in PERFORMANCE_SCHEMA tables: 0B (Tables: 17)
[--] Data in InnoDB tables: 821M (Tables: 512)
[--] Data in MyISAM tables: 1G (Tables: 79)
[--] Data in MEMORY tables: 0B (Tables: 1)
[!!] Total fragmented tables: 534

-------- Security Recommendations  -------------------------------------------
[OK] All database users have passwords assigned

-------- Performance Metrics -------------------------------------------------
[--] Up for: 17h 47m 5s (6M q [104.288 qps], 50K conn, TX: 86B, RX: 2B)
[--] Reads / Writes: 70% / 30%
[--] Total buffers: 1.3G global + 2.7M per thread (151 max threads)
[OK] Maximum possible memory usage: 1.7G (43% of installed RAM)
[OK] Slow queries: 0% (25K/6M)
[OK] Highest usage of available connections: 31% (47/151)
[OK] Key buffer size / total MyISAM indexes: 16.0M/241.8M
[OK] Key buffer hit rate: 99.8% (339M cached / 712K reads)
[OK] Query cache efficiency: 92.0% (5M cached / 6M selects)
[!!] Query cache prunes per day: 81274
[OK] Sorts requiring temporary tables: 0% (683 temp sorts / 110K sorts)
[OK] Temporary tables created on disk: 6% (4K on disk / 69K total)
[OK] Thread cache hit rate: 98% (781 created / 50K connections)
[!!] Table cache hit rate: 18% (800 open / 4K opened)
[OK] Open file limit used: 11% (198/1K)
[OK] Table locks acquired immediately: 99% (839K immediate / 840K locks)
[OK] InnoDB buffer pool / data size: 1.0G/821.4M
[OK] InnoDB log waits: 0
-------- Recommendations -----------------------------------------------------
General recommendations:
    Run OPTIMIZE TABLE to defragment tables for better performance
    MySQL started within last 24 hours - recommendations may be inaccurate
    Increasing the query_cache size over 128M may reduce performance
    Increase table_open_cache gradually to avoid file descriptor limits
    Read this before increasing table_open_cache over 64: http://bit.ly/1mi7c4C
Variables to adjust:
    query_cache_size (> 256M) [see warning above]
    table_open_cache (> 800)
This setting in /etc/mysql/my.cnf has been changed and MySQL has been restarted:
#query_cache_size        = 256M
query_cache_size        = 512M
Changed 3 years ago by chris
Changed 3 years ago by chris
Changed 3 years ago by chris
Changed 3 years ago by chris
Changed 3 years ago by chris
Changed 3 years ago by chris
Changed 3 years ago by chris
Changed 3 years ago by chris
comment:21 Changed 3 years ago by chris
- Add Hours to Ticket changed from 0 to 1
- Total Hours changed from 8.02 to 9.02
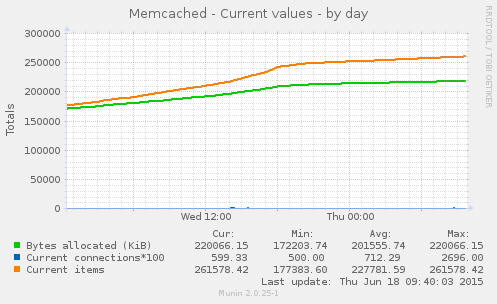
In comments above I was under the impression that memcache Munin units, KiB, were kilobits but looking at the memory usage it is clear they are kilobytes.
The Munin stats for Crin2, memcache has switched to caching items smaller that a kilobyte -- the bytes allocated is now smaller than the number of items in cache.
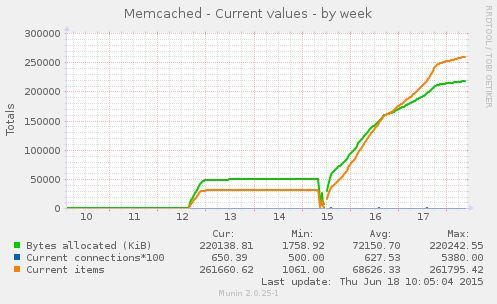
The current memory usage, 220k kilobytes is almost 215M, which makes the current setting in /etc/memcached.conf look reasonable:
# Start with a cap of 64 megs of memory. It's reasonable, and the daemon default
# Note that the daemon will grow to this size, but does not start out holding this much
# memory
#-m 64
-m 512
As it says above memcache doesn't allocate the max memory to start with, unlike Zend OPcache which does, so it's probably fine to leave it as it is (allowed to use twice as much RAM as it is at the moment), in addition we should do our best to avoid memcache restarts and these will have a significant negative impact on the speed of the website.
Looking at the Zend OPcache Munin graph:
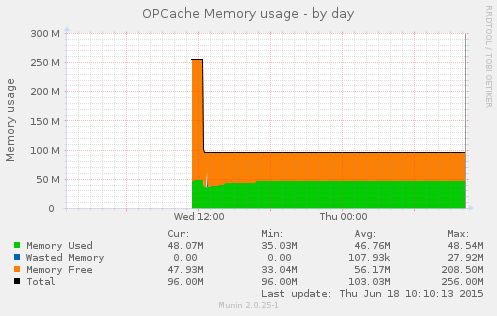
The current setting seem fine, 48M of compiled PHP looks like the size of the site code, the only thing that perhaps might make a difference is switching from mmap memory to using shm (shm is RAM, but mmap probably also results in RAM being used):
opcache.preferred_memory_model
The preferred memory model for OPcache to use. If left empty, OPcache will choose the most appropriate model, which is the correct behaviour in virtually all cases. Possible values include mmap, shm, posix and win32.
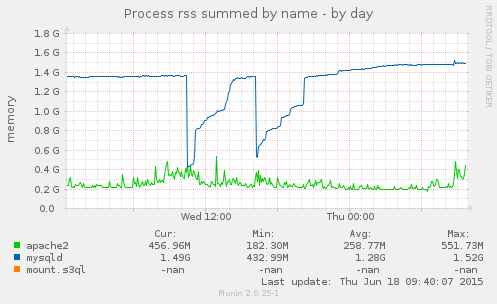
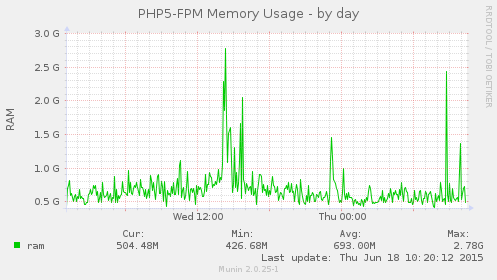
Looking at the php-fpm memory usage, it has hit 2.8G in the last 24 hours, at peak:
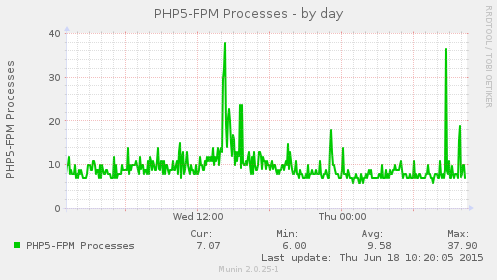
And at this peak there were 40 php-fpm processes:
However given that php-fpm is the only thing on Crin2 that uses a significant amount of memory I don't think this is a problem:
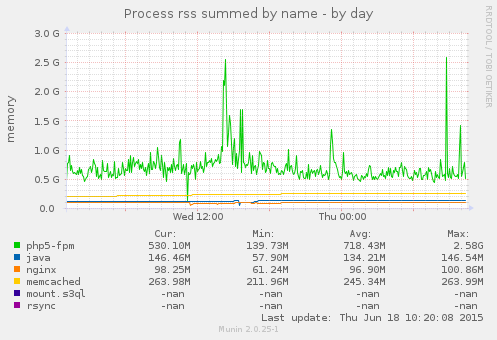
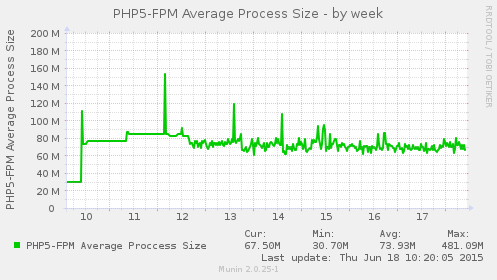
Note that the php-fpm process size is steady:
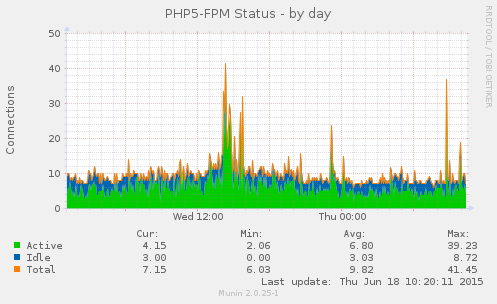
It looks like it would be worth increasing the minimum number of php-fpm processes from the current settings in /etc/php5/fpm/pool.d/www.conf:
; The number of child processes to be created when pm is set to 'static' and the
; maximum number of child processes when pm is set to 'dynamic' or 'ondemand'.
; This value sets the limit on the number of simultaneous requests that will be
; served. Equivalent to the ApacheMaxClients directive with mpm_prefork.
; Equivalent to the PHP_FCGI_CHILDREN environment variable in the original PHP
; CGI. The below defaults are based on a server without much resources. Don't
; forget to tweak pm.* to fit your needs.
; Note: Used when pm is set to 'static', 'dynamic' or 'ondemand'
; Note: This value is mandatory.
;pm.max_children = 5
pm.max_children = 50

; The number of child processes created on startup.
; Note: Used only when pm is set to 'dynamic'
; Default Value: min_spare_servers + (max_spare_servers - min_spare_servers) / 2
;pm.start_servers = 2
pm.start_servers = 3

; The desired minimum number of idle server processes.
; Note: Used only when pm is set to 'dynamic'
; Note: Mandatory when pm is set to 'dynamic'
;pm.min_spare_servers = 1
pm.min_spare_servers = 2

; The desired maximum number of idle server processes.
; Note: Used only when pm is set to 'dynamic'
; Note: Mandatory when pm is set to 'dynamic'
;pm.max_spare_servers = 3
pm.max_spare_servers = 6
Given that spawing new process' will have a time cost, and the /var/log/php5-fpm.log contains a lot of entries like this:
[18-Jun-2015 09:00:29] WARNING: [pool www] seems busy (you may need to increase pm.start_servers, or pm.min/max_spare_servers), spawning 8 children, there are 1 idle, and 19 total children
[18-Jun-2015 09:00:30] WARNING: [pool www] seems busy (you may need to increase pm.start_servers, or pm.min/max_spare_servers), spawning 16 children, there are 0 idle, and 20 total children
[18-Jun-2015 09:00:31] WARNING: [pool www] seems busy (you may need to increase pm.start_servers, or pm.min/max_spare_servers), spawning 32 children, there are 0 idle, and 22 total children
[18-Jun-2015 09:00:32] WARNING: [pool www] seems busy (you may need to increase pm.start_servers, or pm.min/max_spare_servers), spawning 32 children, there are 0 idle, and 24 total children
[18-Jun-2015 09:00:33] WARNING: [pool www] seems busy (you may need to increase pm.start_servers, or pm.min/max_spare_servers), spawning 32 children, there are 0 idle, and 26 total children
[18-Jun-2015 09:00:34] WARNING: [pool www] seems busy (you may need to increase pm.start_servers, or pm.min/max_spare_servers), spawning 32 children, there are 0 idle, and 28 total children
[18-Jun-2015 09:00:35] WARNING: [pool www] seems busy (you may need to increase pm.start_servers, or pm.min/max_spare_servers), spawning 32 children, there are 0 idle, and 30 total children
[18-Jun-2015 09:20:31] WARNING: [pool www] seems busy (you may need to increase pm.start_servers, or pm.min/max_spare_servers), spawning 8 children, there are 0 idle, and 14 total children
[18-Jun-2015 09:20:32] WARNING: [pool www] seems busy (you may need to increase pm.start_servers, or pm.min/max_spare_servers), spawning 16 children, there are 0 idle, and 16 total children
[18-Jun-2015 09:20:33] WARNING: [pool www] seems busy (you may need to increase pm.start_servers, or pm.min/max_spare_servers), spawning 32 children, there are 1 idle, and 18 total children
[18-Jun-2015 09:20:34] WARNING: [pool www] seems busy (you may need to increase pm.start_servers, or pm.min/max_spare_servers), spawning 32 children, there are 1 idle, and 19 total children
[18-Jun-2015 09:45:31] WARNING: [pool www] seems busy (you may need to increase pm.start_servers, or pm.min/max_spare_servers), spawning 8 children, there are 1 idle, and 12 total children
[18-Jun-2015 10:12:06] WARNING: [pool www] seems busy (you may need to increase pm.start_servers, or pm.min/max_spare_servers), spawning 8 children, there are 1 idle, and 15 total children
So /etc/php5/fpm/pool.d/www.conf has been edited to change:
;pm.start_servers = 3
pm.start_servers = 9

;pm.min_spare_servers = 2
pm.min_spare_servers = 6

;pm.max_spare_servers = 6
pm.max_spare_servers = 18
And php5-fpm has been restarted, not this will also cause the Zend OPcache to be flushed so we need to try to avoid doing this too often.
Looking at the Nginx logs, there have been no 502 errors since 6:26 GMT this morning for HTTPS connections and 4 for HTTP connections:
Total 502 errors: 4
Total 503 errors: 0
Total 504 errors: 0

Lines with errors from /var/log/nginx/crin.org.access.log

XX.XX.XX.XX - - [18/Jun/2015:11:04:56 +0000] "GET /en/library/publications/unaids-2008-report-global-aids-epidemic HTTP/1.1" 502 172 "-" "Mozilla/5.0 (compatible; bingbot/2.0; +http://www.bing.com/bingbot.htm)"
XX.XX.XX.XX - - [18/Jun/2015:11:04:56 +0000] "GET /resources/news/xml01.asp?pageID=1010&FeedTitle=CRIN+News+Feed+-+Resources%20-%20CRC%20Documentation HTTP/1.1" 502 574 "-" "Mozilla/4.0 (compatible; MSIE 7.0; Windows NT 6.1; Trident/5.0; SLCC2; .NET CLR 2.0.50727; .NET CLR 3.5.30729; .NET CLR 3.0.30729; Media Center PC 6.0; .NET4.0C; InfoPath.3; .NET4.0E; Microsoft Outlook 14.0.7143; ms-office; MSOffice 14)"
XX.XX.XX.XX - - [18/Jun/2015:11:04:56 +0000] "GET /en/email/crinmail_detail.asp?crinmailID=2594 HTTP/1.1" 502 172 "-" "Mozilla/5.0 (compatible; DotBot/1.1; http://www.opensiteexplorer.org/dotbot, help@moz.com)"
XX.XX.XX.XX - - [18/Jun/2015:11:04:56 +0000] "GET /en/resources/news/xml01.asp?pageID=1016&FeedTitle=CRIN%20News%20Feed%20-%20For%20Children&destination=resources/news/xml01.asp&qt-countr-tabs=2#qt-countr-tabs HTTP/1.1" 502 172 "http://www.crin.org/en/resources/news/xml01.asp?pageID=1016&FeedTitle=CRIN%20News%20Feed%20-%20For%20Children&destination=resources/news/xml01.asp&qt-countr-tabs=2#qt-countr-tabs" "Alltop/1.1"
The first one was bingbot requesting this page and the other 3 were all for old .asp URLs.
comment:22 Changed 3 years ago by chris
- Add Hours to Ticket changed from 0 to 0.05
- Cc jenny gillian added; jonas removed
- Total Hours changed from 9.02 to 9.07
Very sorry I have only just noticed that Jonas and not Jenny and Gillian were CCs for this ticket, that has now been changed.
Also I'm afraid 9 hours has been spent on this ticket so far rather than the estimated 4 hours, but the site is still slower than it was at GreenQloud -- I haven't got to the bottom of the performance problem.
Checking the sites using the Pingdom Full Page Test the main issues I can see are:
- The front page, index.php at https://www.crin.org/ seems to generally take between 4 and 5 seconds to generate, this is really slow, I don't know why it is so slow.
- The number of CSS and Javascript files (32 and 14) could be dramatically reduced through the use of a plugin such as Minify.
I don't, at the moment, know what can be done about 1., 2. is a Drupal issue.
comment:23 Changed 3 years ago by chris
- Add Hours to Ticket changed from 0 to 0.15
- Total Hours changed from 9.07 to 9.22
I saw this error in the dblog:
Type backup_migrate
Message Could not complete the backup because the script timed out. Try increasing your PHP max_execution_time setting.
So these settings were edited in /etc/php5/fpm/php.ini:
;max_execution_time = 30
max_execution_time = 240

;max_input_time = 60
max_input_time = 120

;default_socket_timeout = 60
default_socket_timeout = 120
And php5-fpm was restarted.
comment:24 Changed 3 years ago by chris
I think this ticket can probably be closed?
Looking at the Munin graphs everything seems fine (the number of pfp5-fpm and nginx processes could probably be reduced since the number of services started was set before the network driver fix).
comment:39 Changed 3 years ago by gillian
Hi, Yes unless Jenny has any reservations.
Best,Gillian

On 30 June 2015 at 11:15, CRIN Trac <trac@trac.crin.org> wrote:

> #9: Monitor and adjust server settings after Crin1 and Crin2 server go live
> -------------------------------------+-------------------------------------
>                  Reporter:  chris    |                Owner:  chris
>                      Type:  task     |               Status:  new
>                  Priority:  major    |            Milestone:  Make Crin1
>                                      |  and Crin2 live and monitor
>                 Component:  crin1    |              Version:
>                Resolution:           |             Keywords:
> Estimated Number of Hours:  4        |  Add Hours to Ticket:  0
>                 Billable?:  1        |          Total Hours:  9.22
> -------------------------------------+-------------------------------------
>
> Comment (by chris):
>
>  I think this ticket can probably be closed?
>
>  Looking at the [https://munin.crin.org/ Munin graphs] everything seems
>  fine (the number of `pfp5-fpm` and `nginx` processes could probably be
>  reduced since the number of services started was set before the network
>  driver fix).
>
> --
> Ticket URL: <https://trac.crin.org.archived.website/trac/ticket/9#comment:24>
> CRIN Trac <https://trac.crin.org.archived.website/trac>
> Trac project for CRIN website and servers.
>


--
Gillian Harrow
Organisational Development Manager

*Child Rights International Network - CRIN*
Unit W125-127, Westminster Business Square
1-45 Durham Street
London SE11 5JH
United Kingdom

E: gillian@crin.org
T: +44 (0)20 7401 2257
Website: www.crin.org
Twitter: @CRINwire
comment:40 Changed 3 years ago by jenny
Sorry I missed this one - yes, fine!

On 1 July 2015 at 17:53, Gillian Harrow <gillian@crin.org> wrote:

> Hi, Yes unless Jenny has any reservations.
> Best,Gillian
>
> On 30 June 2015 at 11:15, CRIN Trac <trac@trac.crin.org> wrote:
>
>> #9: Monitor and adjust server settings after Crin1 and Crin2 server go
>> live
>>
>> -------------------------------------+-------------------------------------
>>                  Reporter:  chris    |                Owner:  chris
>>                      Type:  task     |               Status:  new
>>                  Priority:  major    |            Milestone:  Make Crin1
>>                                      |  and Crin2 live and monitor
>>                 Component:  crin1    |              Version:
>>                Resolution:           |             Keywords:
>> Estimated Number of Hours:  4        |  Add Hours to Ticket:  0
>>                 Billable?:  1        |          Total Hours:  9.22
>>
>> -------------------------------------+-------------------------------------
>>
>> Comment (by chris):
>>
>>  I think this ticket can probably be closed?
>>
>>  Looking at the [https://munin.crin.org/ Munin graphs] everything seems
>>  fine (the number of `pfp5-fpm` and `nginx` processes could probably be
>>  reduced since the number of services started was set before the network
>>  driver fix).
>>
>> --
>> Ticket URL: <https://trac.crin.org.archived.website/trac/ticket/9#comment:24>
>> CRIN Trac <https://trac.crin.org.archived.website/trac>
>> Trac project for CRIN website and servers.
>>
>
>
>
> --
> Gillian Harrow
> Organisational Development Manager
>
> *Child Rights International Network - CRIN*
> Unit W125-127, Westminster Business Square
> 1-45 Durham Street
> London SE11 5JH
> United Kingdom
>
> E: gillian@crin.org
> T: +44 (0)20 7401 2257
> Website: www.crin.org
> Twitter: @CRINwire
>
comment:41 Changed 3 years ago by chris
- Resolution set to fixed
- Status changed from new to closed
It appears from the Munin graphs that APC isn't doing anything -- this needs more investigation.
Memcache is working fine.
There was this issue on the status page:
So this was changed to localhost on the solr settings page.