Opened 3 years ago
Closed 2 years ago
#50 closed enhancement (fixed)
Migrate to INNODB
| Reported by: | chris | Owned by: | peter |
|---|---|---|---|
| Priority: | major | Milestone: | Maintenance |
| Component: | crin2 | Version: | |
| Keywords: | Cc: | chris | |
| Estimated Number of Hours: | 0 | Add Hours to Ticket: | 0 |
| Billable?: | yes | Total Hours: | 2.65 |
Description
Email from Peter:
What is involved in changing any of the underlying server resources for
Crin.org.
I think we generally have too many CPU's and not enough memory.
To improve the site performance, we need to move the database to INNODB.
But we are also already using swap on the DB server, and INNODB wants the
entire DB in ram. I think we should switch to at least 8GB ram, but can
probably scale down to 4 cpus - and still get a performance increase.
Attachments (9)
Change History (32)
comment:1 Changed 3 years ago by chris
- Add Hours to Ticket changed from 0 to 0.7
- Total Hours set to 0.7
comment:2 Changed 3 years ago by chris
BTW I don't really have any spare time to work on this until 1st December -- I'm paid to do 8.5 hours a month and this month I have clocked 8.6 already.
comment:3 follow-up: ↓ 4 Changed 3 years ago by peter
Hi Chris We should move everything to innodb, and get it all to run from ram. The slow query log is showing some horrendous times. The whole site is locking up waiting for the db. I have a pro New Relic subscription. Do you mind if I install a client on the production box to do some deeper profiling? On 25 November 2015 at 10:42, CRIN Trac <trac@trac.crin.org> wrote: > #50: Migrate to INNODB > -------------------------------------+------------------------------------- > Reporter: chris | Owner: peter > Type: | Status: new > enhancement | > Priority: major | Milestone: Maintenance > Component: crin2 | Version: > Resolution: | Keywords: > Estimated Number of Hours: 0 | Add Hours to Ticket: 0 > Billable?: 1 | Total Hours: 0.7 > -------------------------------------+------------------------------------- > > Comment (by chris): > > BTW I don't really have any spare time to work on this until 1st December > -- I'm paid to do 8.5 hours a month and this month I have clocked 8.6 > already. > > -- > Ticket URL: <https://trac.crin.org.archived.website/trac/ticket/50#comment:2> > CRIN Trac <https://trac.crin.org.archived.website/trac> > Trac project for CRIN website and servers. > -- =============================================================== Code Positive Ltd. Drupal + http://codepositive.com Skills.Networks.Process.Development Office: 0207 987 3928 Mobile: 07971 478 482 Skype: the-greenman twitter: @greenman
comment:4 in reply to: ↑ 3 Changed 3 years ago by chris
- Add Hours to Ticket changed from 0 to 0.1
- Total Hours changed from 0.7 to 0.8
Replying to peter:
We should move everything to innodb
Are any of the tables using MyISAM using FULLTEXT search indexes?
and get it all to run from ram.
That would be good, what do you think of my suggestion to have a new dedicated production MySQL server running MySQL 5.6? We could then keep the existing server for the dev / stage sites and other applications (Piwik, ownCloud etc). The production DB is 2.2G when dumped as plain text, would a 3GB RAM virtual server be enough if it is just used for MySQL and this database?
The slow query log is showing some horrendous times. The whole site is locking
up waiting for the db.
That is horrible, what URL's generate queries that cause this? Can we use Varnish or something to cache generated pages?
I have a pro New Relic subscription. Do you mind if I install a client on
the production box to do some deeper profiling?
Go for it, be interesting to see what it finds, but in my experience it's quite hard to remove all their code afterwards...
comment:5 follow-up: ↓ 6 Changed 3 years ago by peter
Table optimitation: I will explore the slow queries in a little more detail. There are some very nasty search queries. The url_aliases cause a lot of problem too - moving them to isam will probably immediately help. New box: Watching the DB server yesterday, it never really seemed to get a load above 4 - and on a 10 CPU box, that is fine. So I would prefer to optimise things as they are. Varnish/cache: Although I think we may be able to get some performance for anonymous users with some better caching, the real bottleneck is the DB right now. Once we have the pages cached, things work ok - but no caching is working for authenticated users, and when a cache is invalidated we essentially loose the site for a while because of the database locks. On 25 November 2015 at 11:17, CRIN Trac <trac@trac.crin.org> wrote: > #50: Migrate to INNODB > -------------------------------------+------------------------------------- > Reporter: chris | Owner: peter > Type: | Status: new > enhancement | > Priority: major | Milestone: Maintenance > Component: crin2 | Version: > Resolution: | Keywords: > Estimated Number of Hours: 0 | Add Hours to Ticket: 0.1 > Billable?: 1 | Total Hours: 0.7 > -------------------------------------+------------------------------------- > Changes (by chris): > > * hours: 0 => 0.1 > * totalhours: 0.7 => 0.8 > > > Comment: > > Replying to [comment:3 peter]: > > > > We should move everything to innodb > > Are any of the tables using MyISAM using FULLTEXT search indexes? > > > and get it all to run from ram. > > That would be good, what do you think of my suggestion to have a new > dedicated production MySQL server running MySQL 5.6? We could then keep > the existing server for the dev / stage sites and other applications > (Piwik, ownCloud etc). The production DB is 2.2G when dumped as plain > text, would a 3GB RAM virtual server be enough if it is just used for > MySQL and this database? > > > The slow query log is showing some horrendous times. The whole site is > locking > > up waiting for the db. > > That is horrible, what URL's generate queries that cause this? Can we use > Varnish or something to cache generated pages? > > > I have a pro New Relic subscription. Do you mind if I install a client > on > > the production box to do some deeper profiling? > > Go for it, be interesting to see what it finds, but in my experience it's > quite hard to remove all their code afterwards... > > -- > Ticket URL: <https://trac.crin.org.archived.website/trac/ticket/50#comment:4> > CRIN Trac <https://trac.crin.org.archived.website/trac> > Trac project for CRIN website and servers. > -- =============================================================== Code Positive Ltd. Drupal + http://codepositive.com Skills.Networks.Process.Development Office: 0207 987 3928 Mobile: 07971 478 482 Skype: the-greenman twitter: @greenman
comment:6 in reply to: ↑ 5 Changed 3 years ago by chris
- Add Hours to Ticket changed from 0 to 0.05
- Total Hours changed from 0.8 to 0.85
Replying to peter:
The url_aliases cause a lot of problem too -
moving them to isam will probably immediately help.
Is this something you are happy to do? I can do it if needs be but would need some pointers regarding how to test the results on the dev or staging server before doing it on the live server.
comment:7 Changed 3 years ago by chris
- Add Hours to Ticket changed from 0 to 0.15
- Total Hours changed from 0.85 to 1.0
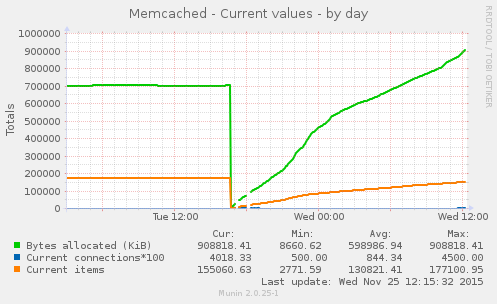
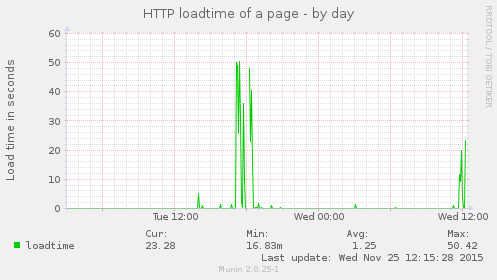
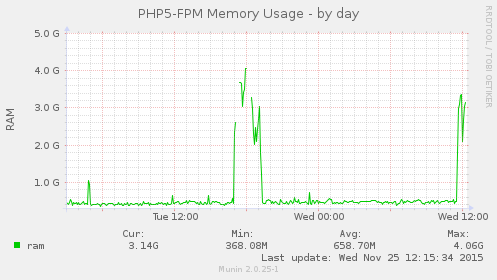
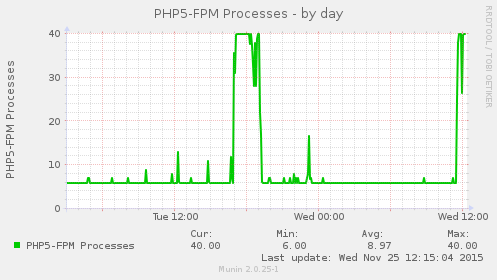
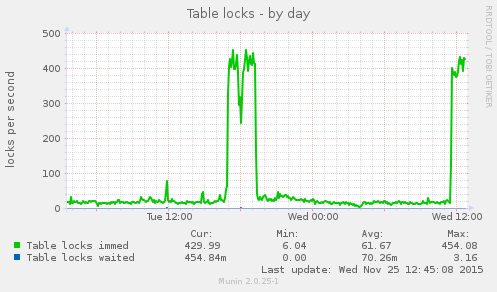
Looking at the Crin1 Munin stats:
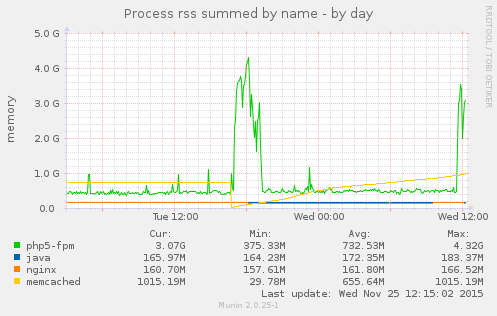
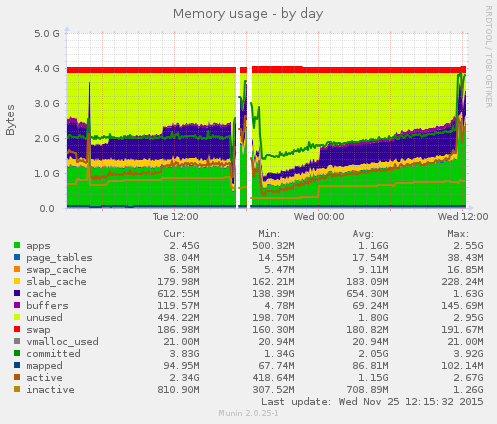
There was a massive load spike yesterday between 5-7pm and this coincided with a memcached restart, any idea what caused that?
Changed 3 years ago by chris
comment:9 Changed 3 years ago by peter
I deployed an update to the code. We have been working on the deployment automation process, and added an automatic purge of APM and Memcache. I think I will remove the memcache from the script. On 25 November 2015 at 12:14, CRIN Trac <trac@trac.crin.org> wrote: > #50: Migrate to INNODB > -------------------------------------+------------------------------------- > Reporter: chris | Owner: peter > Type: | Status: new > enhancement | > Priority: major | Milestone: Maintenance > Component: crin2 | Version: > Resolution: | Keywords: > Estimated Number of Hours: 0 | Add Hours to Ticket: 0.15 > Billable?: 1 | Total Hours: 0.85 > -------------------------------------+------------------------------------- > Changes (by chris): > > * hours: 0 => 0.15 > * totalhours: 0.85 => 1.0 > > > Comment: > > Looking at the [[Crin1]] Munin stats: > > - https://munin.crin.org/munin/crin.org/crin2.crin.org/index.html > > There was a massive load spike yesterday between 5-7pm and this coincided > with a memcached restart, any idea what caused that? > > -- > Ticket URL: <https://trac.crin.org.archived.website/trac/ticket/50#comment:7> > CRIN Trac <https://trac.crin.org.archived.website/trac> > Trac project for CRIN website and servers. > -- =============================================================== Code Positive Ltd. Drupal + http://codepositive.com Skills.Networks.Process.Development Office: 0207 987 3928 Mobile: 07971 478 482 Skype: the-greenman twitter: @greenman
Changed 3 years ago by chris
Changed 3 years ago by chris
Changed 3 years ago by chris
Changed 3 years ago by chris
Changed 3 years ago by chris
comment:10 Changed 3 years ago by chris
- Add Hours to Ticket changed from 0 to 0.15
- Total Hours changed from 1.0 to 1.15
There were 560 HTTP 502 errors between 16:44 and 18:14 yesterday, this is a lot higher than usual, here is a list of the recent number of HTTP 502 errors by day:
Sep 25 1 502, 0 503 and 0 504 errors Sep 30 1 502, 0 503 and 0 504 errors Oct 01 1 502, 0 503 and 0 504 errors Oct 06 2 502, 0 503 and 0 504 errors Oct 08 2 502, 0 503 and 0 504 errors Oct 09 2 502, 0 503 and 0 504 errors Oct 10 2 502, 0 503 and 0 504 errors Oct 11 3 502, 0 503 and 0 504 errors Oct 13 1 502, 0 503 and 0 504 errors Oct 14 4 502, 0 503 and 0 504 errors Oct 16 3 502, 0 503 and 0 504 errors Oct 19 2 502, 0 503 and 0 504 errors Oct 20 3 502, 0 503 and 0 504 errors Oct 21 1 502, 0 503 and 0 504 errors Oct 22 3 502, 0 503 and 0 504 errors Oct 23 3 502, 0 503 and 0 504 errors Oct 24 2 502, 0 503 and 0 504 errors Oct 25 3 502, 0 503 and 0 504 errors Oct 26 1 502, 0 503 and 0 504 errors Oct 27 4 502, 0 503 and 0 504 errors Oct 28 4 502, 0 503 and 0 504 errors Oct 28 29 502, 0 503 and 0 504 errors Oct 29 3 502, 0 503 and 0 504 errors Oct 30 2 502, 0 503 and 0 504 errors Oct 31 155 502, 0 503 and 0 504 errors Nov 01 1 502, 0 503 and 0 504 errors Nov 02 3 502, 0 503 and 0 504 errors Nov 03 2 502, 0 503 and 0 504 errors Nov 04 1 502, 0 503 and 0 504 errors Nov 05 7 502, 0 503 and 0 504 errors Nov 05 123 502, 0 503 and 0 504 errors Nov 06 4 502, 0 503 and 0 504 errors Nov 07 1 502, 0 503 and 0 504 errors Nov 08 1 502, 0 503 and 0 504 errors Nov 09 2 502, 0 503 and 0 504 errors Nov 10 57 502, 0 503 and 0 504 errors Nov 22 87 502, 0 503 and 0 504 errors Nov 23 1 502, 0 503 and 0 504 errors Nov 24 166 502, 0 503 and 0 504 errors Nov 25 560 502, 0 503 and 0 504 errors
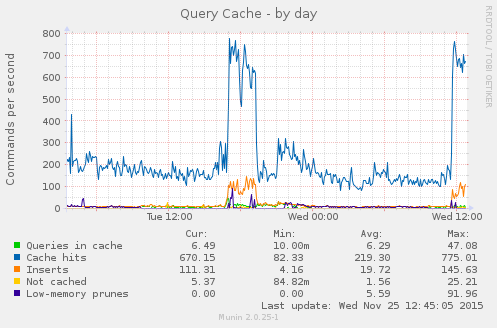
I have also attached some of the munin graphs to record yesterdays load spike.
comment:16 follow-up: ↓ 18 Changed 3 years ago by peter
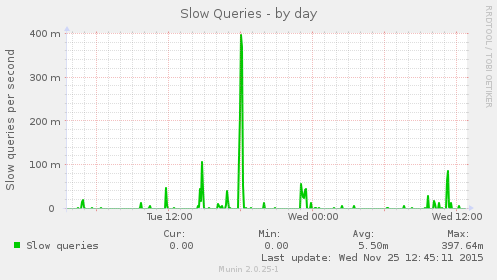
Is there any munin monitoring for slow queries? I would like to see that
too.
I have been adding some translation information today, since just before
12, it's impressive that we get such a significant resource use spike.
On 25 November 2015 at 12:30, CRIN Trac <trac@trac.crin.org> wrote:
> #50: Migrate to INNODB
> -------------------------------------+-------------------------------------
> Reporter: chris | Owner: peter
> Type: | Status: new
> enhancement |
> Priority: major | Milestone: Maintenance
> Component: crin2 | Version:
> Resolution: | Keywords:
> Estimated Number of Hours: 0 | Add Hours to Ticket: 0.15
> Billable?: 1 | Total Hours: 1.0
> -------------------------------------+-------------------------------------
> Changes (by chris):
>
> * hours: 0 => 0.15
> * totalhours: 1.0 => 1.15
>
>
> Comment:
>
> There were 560 HTTP 502 errors between 16:44 and 18:14 yesterday, this is
> a lot higher than usual, here is a list of the recent number of HTTP 502
> errors by day:
>
> {{{
> Sep 25 1 502, 0 503 and 0 504 errors
> Sep 30 1 502, 0 503 and 0 504 errors
> Oct 01 1 502, 0 503 and 0 504 errors
> Oct 06 2 502, 0 503 and 0 504 errors
> Oct 08 2 502, 0 503 and 0 504 errors
> Oct 09 2 502, 0 503 and 0 504 errors
> Oct 10 2 502, 0 503 and 0 504 errors
> Oct 11 3 502, 0 503 and 0 504 errors
> Oct 13 1 502, 0 503 and 0 504 errors
> Oct 14 4 502, 0 503 and 0 504 errors
> Oct 16 3 502, 0 503 and 0 504 errors
> Oct 19 2 502, 0 503 and 0 504 errors
> Oct 20 3 502, 0 503 and 0 504 errors
> Oct 21 1 502, 0 503 and 0 504 errors
> Oct 22 3 502, 0 503 and 0 504 errors
> Oct 23 3 502, 0 503 and 0 504 errors
> Oct 24 2 502, 0 503 and 0 504 errors
> Oct 25 3 502, 0 503 and 0 504 errors
> Oct 26 1 502, 0 503 and 0 504 errors
> Oct 27 4 502, 0 503 and 0 504 errors
> Oct 28 4 502, 0 503 and 0 504 errors
> Oct 28 29 502, 0 503 and 0 504 errors
> Oct 29 3 502, 0 503 and 0 504 errors
> Oct 30 2 502, 0 503 and 0 504 errors
> Oct 31 155 502, 0 503 and 0 504 errors
> Nov 01 1 502, 0 503 and 0 504 errors
> Nov 02 3 502, 0 503 and 0 504 errors
> Nov 03 2 502, 0 503 and 0 504 errors
> Nov 04 1 502, 0 503 and 0 504 errors
> Nov 05 7 502, 0 503 and 0 504 errors
> Nov 05 123 502, 0 503 and 0 504 errors
> Nov 06 4 502, 0 503 and 0 504 errors
> Nov 07 1 502, 0 503 and 0 504 errors
> Nov 08 1 502, 0 503 and 0 504 errors
> Nov 09 2 502, 0 503 and 0 504 errors
> Nov 10 57 502, 0 503 and 0 504 errors
> Nov 22 87 502, 0 503 and 0 504 errors
> Nov 23 1 502, 0 503 and 0 504 errors
> Nov 24 166 502, 0 503 and 0 504 errors
> Nov 25 560 502, 0 503 and 0 504 errors
> }}}
>
> I have also attached some of the munin graphs to record yesterdays load
> spike.
>
> [[Image(memcached_counters-day.png)]]
> [[Image(http_loadtime-day.png)]]
> [[Image(phpfpm_memory-day.png)]]
> [[Image(phpfpm_processes-day.png)]]
> [[Image(multips_memory-day.png)]]
> [[Image(memory-day.png)]]
>
> --
> Ticket URL: <https://trac.crin.org.archived.website/trac/ticket/50#comment:10>
> CRIN Trac <https://trac.crin.org.archived.website/trac>
> Trac project for CRIN website and servers.
>
--
===============================================================
Code Positive Ltd. Drupal +
http://codepositive.com
Skills.Networks.Process.Development
Office: 0207 987 3928
Mobile: 07971 478 482
Skype: the-greenman
twitter: @greenman
Changed 3 years ago by chris
Changed 3 years ago by chris
Changed 3 years ago by chris
comment:17 Changed 3 years ago by chris
- Add Hours to Ticket changed from 0 to 0.2
- Total Hours changed from 1.15 to 1.35
Replying to peter:
I deployed an update to the code.
Ah, that explains it, I was wondering if that was the cause.
We have been working on the deployment
automation process, and added an automatic purge of APM and Memcache.
What is APM?
I think I will remove the memcache from the script.
I'm not 100% sure if a memcache restart is needed when new code is deployed, but it does seem like it might be a good idea, however the results are quite horrible in terms of preformance...
Also we shouldn't strictly need a php5-fpm restart as we have this in /etc/php5/fpm/php.ini:
; When disabled, you must reset the OPcache manually or restart the
; webserver for changes to the filesystem to take effect.
;opcache.validate_timestamps=1
opcache.validate_timestamps=1
; How often (in seconds) to check file timestamps for changes to the shared
; memory storage allocation. ("1" means validate once per second, but only
; once per request. "0" means always validate)
;opcache.revalidate_freq=2
opcache.revalidate_freq=300
However I'd suggest that it would make sense to set opcache.validate_timestamps to 0 and to do a php5-fpm restart after new code is deployed to speed things up (file timestamps wouldn't need checking)
Replying to peter:
Is there any munin monitoring for slow queries? I would like to see that
too.
Here are some Munin Mysql graphs for Crin1 for the same period:
The slow query graphs are here:
comment:18 in reply to: ↑ 16 Changed 3 years ago by chris
Replying to peter:
I have been adding some translation information today, since just before
12, it's impressive that we get such a significant resource use spike.
I was also wondering what the cause of that was... yes it is a huge spike... I suspect that the number php5-fpm processes max out, and this is causing the massive memory usage increase, when MySQL is slow.
comment:22 follow-up: ↓ 23 Changed 3 years ago by peter
Sorry, too many acronyms: APM = php4-fpm. That we have set to restart on a deploy. Yes, the issue with load on the site is to do with processes waiting for the db. The table locks are sometimes taking 7 seconds. A url alias update takes 3 seconds. We just get too many processes in the queue and run out of resources even if the box is actually doing nothing. On 25 November 2015 at 12:57, CRIN Trac <trac@trac.crin.org> wrote: > #50: Migrate to INNODB > -------------------------------------+------------------------------------- > Reporter: chris | Owner: peter > Type: | Status: new > enhancement | > Priority: major | Milestone: Maintenance > Component: crin2 | Version: > Resolution: | Keywords: > Estimated Number of Hours: 0 | Add Hours to Ticket: 0 > Billable?: 1 | Total Hours: 1.35 > -------------------------------------+------------------------------------- > > Comment (by chris): > > Replying to [comment:16 peter]: > > > > I have been adding some translation information today, since just before > > 12, it's impressive that we get such a significant resource use spike. > > I was also wondering what the cause of that was... yes it is a ''huge'' > spike... I suspect that the number `php5-fpm` processes max out, and this > is causing the massive memory usage increase, when MySQL is slow. > > -- > Ticket URL: <https://trac.crin.org.archived.website/trac/ticket/50#comment:18> > CRIN Trac <https://trac.crin.org.archived.website/trac> > Trac project for CRIN website and servers. > -- =============================================================== Code Positive Ltd. Drupal + http://codepositive.com Skills.Networks.Process.Development Office: 0207 987 3928 Mobile: 07971 478 482 Skype: the-greenman twitter: @greenman
comment:23 in reply to: ↑ 22 Changed 3 years ago by chris
- Add Hours to Ticket changed from 0 to 0.1
- Total Hours changed from 1.35 to 1.45
Replying to peter:
Sorry, too many acronyms: APM = php4-fpm. That we have set to restart on a
deploy.
OK, I have set opcache.validate_timestamps to 0 for the next time, this should help a little bit...
comment:24 follow-up: ↓ 25 Changed 3 years ago by peter
Hmmm. Well, I have found the biggest issue. It is a bit basic, so I never actually checked before. The ApacheSolr server is not actually being used. The site search is all using the database. On 25 November 2015 at 13:25, CRIN Trac <trac@trac.crin.org> wrote: > #50: Migrate to INNODB > -------------------------------------+------------------------------------- > Reporter: chris | Owner: peter > Type: | Status: new > enhancement | > Priority: major | Milestone: Maintenance > Component: crin2 | Version: > Resolution: | Keywords: > Estimated Number of Hours: 0 | Add Hours to Ticket: 0.1 > Billable?: 1 | Total Hours: 1.35 > -------------------------------------+------------------------------------- > Changes (by chris): > > * hours: 0 => 0.1 > * totalhours: 1.35 => 1.45 > > > Comment: > > Replying to [comment:22 peter]: > > > > Sorry, too many acronyms: APM = php4-fpm. That we have set to restart on > a > > deploy. > > OK, I have set `opcache.validate_timestamps` to `0` for the next time, > this should help a little bit... > > -- > Ticket URL: <https://trac.crin.org.archived.website/trac/ticket/50#comment:23> > CRIN Trac <https://trac.crin.org.archived.website/trac> > Trac project for CRIN website and servers. > -- =============================================================== Code Positive Ltd. Drupal + http://codepositive.com Skills.Networks.Process.Development Office: 0207 987 3928 Mobile: 07971 478 482 Skype: the-greenman twitter: @greenman
comment:25 in reply to: ↑ 24 Changed 3 years ago by chris
- Add Hours to Ticket changed from 0 to 0.1
- Total Hours changed from 1.45 to 1.55
Replying to peter:
The ApacheSolr server is not actually being used. The site search is all
using the database.
Ah ha!
If it helps the notes I made when installing it can be found in the comments on this ticket (search in the page for "solr"):
comment:26 Changed 3 years ago by peter
Solr is fine. We've set it up with multiple cores on the dev site too. I just never checked that that search in the library was actually configured to use it. That seemed too obvious. It will require a fair bit of thinking to work out the right way to re-build. On 25 November 2015 at 14:45, CRIN Trac <trac@trac.crin.org> wrote: > #50: Migrate to INNODB > -------------------------------------+------------------------------------- > Reporter: chris | Owner: peter > Type: | Status: new > enhancement | > Priority: major | Milestone: Maintenance > Component: crin2 | Version: > Resolution: | Keywords: > Estimated Number of Hours: 0 | Add Hours to Ticket: 0.1 > Billable?: 1 | Total Hours: 1.45 > -------------------------------------+------------------------------------- > Changes (by chris): > > * hours: 0 => 0.1 > * totalhours: 1.45 => 1.55 > > > Comment: > > Replying to [comment:24 peter]: > > > > The !ApacheSolr server is not actually being used. The site search is > all > > using the database. > > Ah ha! > > If it helps the notes I made when installing it can be found in the > comments on this ticket (search in the page for "solr"): > > * https://trac.crin.org.archived.website/trac/ticket/6 > > -- > Ticket URL: <https://trac.crin.org.archived.website/trac/ticket/50#comment:25> > CRIN Trac <https://trac.crin.org.archived.website/trac> > Trac project for CRIN website and servers. > -- =============================================================== Code Positive Ltd. Drupal + http://codepositive.com Skills.Networks.Process.Development Office: 0207 987 3928 Mobile: 07971 478 482 Skype: the-greenman twitter: @greenman
comment:27 Changed 3 years ago by chris
- Add Hours to Ticket changed from 0 to 0.1
- Resolution set to fixed
- Status changed from new to closed
- Total Hours changed from 1.55 to 1.65
This ticket has been followed up on ticket:51, specifically ticket:51#comment:29 documents the switch to InnoDB.
comment:28 Changed 3 years ago by chris
- Add Hours to Ticket changed from 0 to 0.25
- Total Hours changed from 1.65 to 1.9
Looking at the slow queries now:
[OK] Slow queries: 0% (144/26M)
Compared with ticket:50#comment:1 which has:
[OK] Slow queries: 0% (7K/519M)
This is about half the number it was:
519/26=20 144x20=2880
Latest mysqltuner output:
>> MySQLTuner 1.3.0 - Major Hayden <major@mhtx.net>
>> Bug reports, feature requests, and downloads at http://mysqltuner.com/
>> Run with '--help' for additional options and output filtering
[OK] Logged in using credentials from debian maintenance account.
[OK] Currently running supported MySQL version 5.5.46-0+deb8u1-log
[OK] Operating on 64-bit architecture
-------- Storage Engine Statistics -------------------------------------------
[--] Status: +ARCHIVE +BLACKHOLE +CSV -FEDERATED +InnoDB +MRG_MYISAM
[--] Data in MEMORY tables: 0B (Tables: 1)
[--] Data in PERFORMANCE_SCHEMA tables: 0B (Tables: 17)
[--] Data in InnoDB tables: 5G (Tables: 1742)
[--] Data in MyISAM tables: 3G (Tables: 241)
[!!] Total fragmented tables: 1779
-------- Security Recommendations -------------------------------------------
[OK] All database users have passwords assigned
-------- Performance Metrics -------------------------------------------------
[--] Up for: 2d 12h 20m 0s (26M q [119.808 qps], 337K conn, TX: 56B, RX: 5B)
[--] Reads / Writes: 95% / 5%
[--] Total buffers: 7.5G global + 2.7M per thread (151 max threads)
[!!] Maximum possible memory usage: 7.9G (101% of installed RAM)
[OK] Slow queries: 0% (144/26M)
[OK] Highest usage of available connections: 27% (41/151)
[OK] Key buffer size / total MyISAM indexes: 1.0G/950.1M
[OK] Key buffer hit rate: 96.6% (9M cached / 320K reads)
[OK] Query cache efficiency: 94.0% (23M cached / 24M selects)
[!!] Query cache prunes per day: 304275
[OK] Sorts requiring temporary tables: 1% (8K temp sorts / 510K sorts)
[OK] Temporary tables created on disk: 8% (30K on disk / 370K total)
[OK] Thread cache hit rate: 99% (120 created / 337K connections)
[!!] Table cache hit rate: 0% (64 open / 147K opened)
[OK] Open file limit used: 0% (1/1K)
[OK] Table locks acquired immediately: 100% (2M immediate / 2M locks)
[OK] InnoDB buffer pool / data size: 6.0G/5.8G
[OK] InnoDB log waits: 0
-------- Recommendations -----------------------------------------------------
General recommendations:
Run OPTIMIZE TABLE to defragment tables for better performance
Reduce your overall MySQL memory footprint for system stability
Increasing the query_cache size over 128M may reduce performance
Increase table_open_cache gradually to avoid file descriptor limits
Read this before increasing table_open_cache over 64: http://bit.ly/1mi7c4C
Variables to adjust:
*** MySQL's maximum memory usage is dangerously high ***
*** Add RAM before increasing MySQL buffer variables ***
query_cache_size (> 512M) [see warning above]
table_open_cache (> 64)
comment:29 follow-up: ↓ 30 Changed 3 years ago by peter
- Resolution fixed deleted
- Status changed from closed to reopened
Logged in site performance is massively improved. If we have more ram available for the front end webserver, the next step should probably involve some reverse proxy action. That however is for a different ticket.
comment:30 in reply to: ↑ 29 Changed 3 years ago by chris
- Add Hours to Ticket changed from 0 to 0.25
- Total Hours changed from 1.9 to 2.15
Replying to peter:
Logged in site performance is massively improved.
Great!
If we have more ram available for the front end webserver, the next step
should probably involve some reverse proxy action. That however is for a
different ticket.
OK, what were you thinking for this, Nginx reverse proxy to Varnish for PHP pages and static content served directly by Nginx?
Or is there a decent Drupal module for generating static HTML which could be served directly by Nginx for non-logged in users -- that in itself might do the trick as we wont be caching content for logged in users.
Varnish would take some time to get set up, I only have a couple of hours left out of the 8.5 a month for December so that would have to wait to the New Year.
I think giving memcache more RAM, I have already increased it to 1.5G, from 1G, might also help.
There is also the issue of the number of JavaScript and CSS files reducing these would help some, eg:
comment:31 Changed 2 years ago by chris
- Add Hours to Ticket changed from 0 to 0.5
- Total Hours changed from 2.15 to 2.65
Looking at the latest output from mysqltuner we have:
>> MySQLTuner 1.3.0 - Major Hayden <major@mhtx.net>
>> Bug reports, feature requests, and downloads at http://mysqltuner.com/
>> Run with '--help' for additional options and output filtering
[OK] Logged in using credentials from debian maintenance account.
[OK] Currently running supported MySQL version 5.5.47-0+deb8u1-log
[OK] Operating on 64-bit architecture
-------- Storage Engine Statistics -------------------------------------------
[--] Status: +ARCHIVE +BLACKHOLE +CSV -FEDERATED +InnoDB +MRG_MYISAM
[--] Data in PERFORMANCE_SCHEMA tables: 0B (Tables: 17)
[--] Data in MEMORY tables: 0B (Tables: 1)
[--] Data in InnoDB tables: 5G (Tables: 1749)
[--] Data in MyISAM tables: 3G (Tables: 241)
[!!] Total fragmented tables: 1791
-------- Security Recommendations -------------------------------------------
[OK] All database users have passwords assigned
-------- Performance Metrics -------------------------------------------------
[--] Up for: 50d 15h 35m 59s (461M q [105.427 qps], 4M conn, TX: 1131B, RX: 107B)
[--] Reads / Writes: 94% / 6%
[--] Total buffers: 7.5G global + 2.7M per thread (151 max threads)
[!!] Maximum possible memory usage: 7.9G (101% of installed RAM)
[OK] Slow queries: 0% (6K/461M)
[OK] Highest usage of available connections: 61% (93/151)
[OK] Key buffer size / total MyISAM indexes: 1.0G/953.6M
[OK] Key buffer hit rate: 96.7% (709M cached / 23M reads)
[OK] Query cache efficiency: 90.5% (398M cached / 440M selects)
[!!] Query cache prunes per day: 305433
[OK] Sorts requiring temporary tables: 3% (399K temp sorts / 12M sorts)
[OK] Temporary tables created on disk: 7% (688K on disk / 9M total)
[OK] Thread cache hit rate: 99% (1K created / 4M connections)
[!!] Table cache hit rate: 0% (64 open / 3M opened)
[OK] Open file limit used: 0% (5/1K)
[OK] Table locks acquired immediately: 99% (57M immediate / 57M locks)
[OK] InnoDB buffer pool / data size: 6.0G/6.0G
[OK] InnoDB log waits: 0
-------- Recommendations -----------------------------------------------------
General recommendations:
Run OPTIMIZE TABLE to defragment tables for better performance
Reduce your overall MySQL memory footprint for system stability
Increasing the query_cache size over 128M may reduce performance
Increase table_open_cache gradually to avoid file descriptor limits
Read this before increasing table_open_cache over 64: http://bit.ly/1mi7c4C
Variables to adjust:
*** MySQL's maximum memory usage is dangerously high ***
*** Add RAM before increasing MySQL buffer variables ***
query_cache_size (> 512M) [see warning above]
table_open_cache (> 64)
The things that catch my eye in the above are these lines:
[OK] Key buffer size / total MyISAM indexes: 1.0G/953.6M [OK] InnoDB buffer pool / data size: 6.0G/6.0G
Looking at the database sizes:
mysql> SELECT table_schema AS "Database name", SUM(data_length + index_length) / 1024 / 1024 AS "Size (MB)" FROM information_schema.TABLES GROUP BY table_schema; +--------------------+---------------+ | Database name | Size (MB) | +--------------------+---------------+ | dev | 3904.69225407 | | drupal | 3051.08326149 | | information_schema | 0.00878906 | | mediawiki | 89.25001144 | | mysql | 0.67861366 | | newprod | 4673.16688919 | | owncloud | 3.76562500 | | performance_schema | 0.00000000 | | phpmyadmin | 0.34375000 | | piwik | 417.60937500 | | stage | 2834.09900856 | +--------------------+---------------+ 11 rows in set (28.54 sec)
I think the drupal database might no longer be needed, looking at the nginx config we have these sym links in /etc/nginx/sites-enabled/:
/etc/nginx/sites-enabled/00-crin.org /etc/nginx/sites-enabled/01-newprod.crin.org
The 00-crin.org config has:
server_name www.crin.org;
root /var/www/prod/docroot;
And 01-newprod.crin.org has:
server_name newprod.crin.org;
root /var/www/newprod/docroot;
And /var/www/newprod/ doesn't exist, but there is a /var/www/prod-old which is dated Jul 20 2015, so these are safe to delete:
rm -rf /var/www/prod-old rm /etc/nginx/sites-enabled/01-newprod.crin.org service nginx restart
Also the /var/www/prod/docroot/sites/default/settings.php file is set to use the newprod database so the drupal one can be dropped:
mysql> drop database drupal; Query OK, 453 rows affected (3.62 sec)
So now mysqltuner has this result:
>> MySQLTuner 1.3.0 - Major Hayden <major@mhtx.net>
>> Bug reports, feature requests, and downloads at http://mysqltuner.com/
>> Run with '--help' for additional options and output filtering
[OK] Logged in using credentials from debian maintenance account.
[OK] Currently running supported MySQL version 5.5.47-0+deb8u1-log
[OK] Operating on 64-bit architecture
-------- Storage Engine Statistics -------------------------------------------
[--] Status: +ARCHIVE +BLACKHOLE +CSV -FEDERATED +InnoDB +MRG_MYISAM
[--] Data in PERFORMANCE_SCHEMA tables: 0B (Tables: 17)
[--] Data in InnoDB tables: 5G (Tables: 1374)
[--] Data in MyISAM tables: 2G (Tables: 163)
[--] Data in MEMORY tables: 0B (Tables: 1)
[!!] Total fragmented tables: 1405
-------- Security Recommendations -------------------------------------------
[OK] All database users have passwords assigned
-------- Performance Metrics -------------------------------------------------
[--] Up for: 50d 16h 2m 51s (461M q [105.424 qps], 4M conn, TX: 1131B, RX: 107B)
[--] Reads / Writes: 94% / 6%
[--] Total buffers: 7.5G global + 2.7M per thread (151 max threads)
[!!] Maximum possible memory usage: 7.9G (101% of installed RAM)
[OK] Slow queries: 0% (6K/461M)
[OK] Highest usage of available connections: 61% (93/151)
[OK] Key buffer size / total MyISAM indexes: 1.0G/708.9M
[OK] Key buffer hit rate: 96.7% (711M cached / 23M reads)
[OK] Query cache efficiency: 90.5% (398M cached / 440M selects)
[!!] Query cache prunes per day: 305321
[OK] Sorts requiring temporary tables: 3% (399K temp sorts / 12M sorts)
[OK] Temporary tables created on disk: 7% (688K on disk / 9M total)
[OK] Thread cache hit rate: 99% (1K created / 4M connections)
[!!] Table cache hit rate: 0% (64 open / 3M opened)
[OK] Open file limit used: 0% (1/1K)
[OK] Table locks acquired immediately: 99% (57M immediate / 57M locks)
[OK] InnoDB buffer pool / data size: 6.0G/5.3G
[OK] InnoDB log waits: 0
-------- Recommendations -----------------------------------------------------
General recommendations:
Run OPTIMIZE TABLE to defragment tables for better performance
Reduce your overall MySQL memory footprint for system stability
Increasing the query_cache size over 128M may reduce performance
Increase table_open_cache gradually to avoid file descriptor limits
Read this before increasing table_open_cache over 64: http://bit.ly/1mi7c4C
Variables to adjust:
*** MySQL's maximum memory usage is dangerously high ***
*** Add RAM before increasing MySQL buffer variables ***
query_cache_size (> 512M) [see warning above]
table_open_cache (> 64)
And these variables now have some slack:
[OK] Key buffer size / total MyISAM indexes: 1.0G/708.9M [OK] InnoDB buffer pool / data size: 6.0G/5.3G
Closing this ticket, if needs be new ones can be opened.
comment:32 Changed 2 years ago by chris
- Resolution set to fixed
- Status changed from reopened to closed

The ratio of RAM / CPU is set by 1984.is, see https://1984.is/product/vps/ so 8GB of RAM would come with 12 CPUs and this would double the cost of this server.
We are using some swap on the server because I intentionally increased the MySQL memory usage right up to the limits of what is available in order to speed things up.
The newprod database is 2.2G when dumped as plain text:
I'm happy to liase with 1984.is regarding scaling up the server, as long as CRIN are happy with the additional costs.
I'm not clear however what the exact problem you want to solve is? If it is the speed of dynamic queries (eg searches) then MySQL might be the bottle neck but if the issue is with the speed of pages then wouldn't it be better to explore caching of the generated content, eg using Varnish?
The front page loads 32 CSS files and 13 Javascript files, can this be optimised using something like minify? https://www.drupal.org/project/minify
Can we look at the slow query log (and change the threshold for this if need be) to find out where the slow queries are being generated?
Following is the result from running mysqltuner on the server:
 >>  MySQLTuner 1.3.0 - Major Hayden <major@mhtx.net>
 >>  Bug reports, feature requests, and downloads at http://mysqltuner.com/
 >>  Run with '--help' for additional options and output filtering
[OK] Logged in using credentials from debian maintenance account.
[OK] Currently running supported MySQL version 5.5.46-0+deb8u1-log
[OK] Operating on 64-bit architecture

-------- Storage Engine Statistics -------------------------------------------
[--] Status: +ARCHIVE +BLACKHOLE +CSV -FEDERATED +InnoDB +MRG_MYISAM
[--] Data in InnoDB tables: 4G (Tables: 1666)
[--] Data in MyISAM tables: 4G (Tables: 317)
[--] Data in PERFORMANCE_SCHEMA tables: 0B (Tables: 17)
[--] Data in MEMORY tables: 0B (Tables: 1)
[!!] Total fragmented tables: 1721

-------- Security Recommendations  -------------------------------------------
[OK] All database users have passwords assigned

-------- Performance Metrics -------------------------------------------------
[--] Up for: 32d 1h 21m 17s (519M q [187.492 qps], 4M conn, TX: 949B, RX: 127B)
[--] Reads / Writes: 78% / 22%
[--] Total buffers: 1.5G global + 2.7M per thread (151 max threads)
[OK] Maximum possible memory usage: 1.9G (50% of installed RAM)
[OK] Slow queries: 0% (7K/519M)
[OK] Highest usage of available connections: 49% (74/151)
[OK] Key buffer size / total MyISAM indexes: 16.0M/996.2M
[OK] Key buffer hit rate: 99.9% (38B cached / 22M reads)
[OK] Query cache efficiency: 93.9% (462M cached / 492M selects)
[!!] Query cache prunes per day: 399459
[OK] Sorts requiring temporary tables: 1% (97K temp sorts / 9M sorts)
[OK] Temporary tables created on disk: 5% (420K on disk / 7M total)
[OK] Thread cache hit rate: 99% (17K created / 4M connections)
[!!] Table cache hit rate: 0% (800 open / 554K opened)
[OK] Open file limit used: 15% (271/1K)
[OK] Table locks acquired immediately: 99% (52M immediate / 52M locks)
[!!] InnoDB  buffer pool / data size: 1.0G/4.7G
[OK] InnoDB log waits: 0
-------- Recommendations -----------------------------------------------------
General recommendations:
    Run OPTIMIZE TABLE to defragment tables for better performance
    Increasing the query_cache size over 128M may reduce performance
    Increase table_open_cache gradually to avoid file descriptor limits
    Read this before increasing table_open_cache over 64: http://bit.ly/1mi7c4C
Variables to adjust:
    query_cache_size (> 512M) [see warning above]
    table_open_cache (> 800)
    innodb_buffer_pool_size (>= 4G)
Looking at which tables use InnoDB:
And which use MyISAM:
I'm not sure which of the above tables can be converted, we are running:
InnoDB "doesn't have FULLTEXT search indexes until v5.6", https://dba.stackexchange.com/questions/1/what-are-the-main-differences-between-innodb-and-myisam so perhaps we should consider a new production MySQL server running Debian stretch which has 5.6?