Opened 2 years ago
Last modified 2 years ago
#73 new defect
CRIN2 ran out of memory
| Reported by: | chris | Owned by: | chris |
|---|---|---|---|
| Priority: | critical | Milestone: | Maintenance |
| Component: | crin2 | Version: | |
| Keywords: | Cc: | peter | |
| Estimated Number of Hours: | 0 | Add Hours to Ticket: | 0 |
| Billable?: | yes | Total Hours: | 7.14 |
Description
The site has been down since Sun, 01 May 2016 18:05:44, it is now 8:15. I'm rebooting the server, it ran out of memory.
Attachments (10)
Change History (42)
comment:1 Changed 2 years ago by chris
- Add Hours to Ticket changed from 0 to 0.25
- Total Hours set to 0.25
comment:2 Changed 2 years ago by chris
Actually it looks more like it might be a DDOS attack or something.
comment:3 Changed 2 years ago by chris
- Add Hours to Ticket changed from 0 to 0.25
- Total Hours changed from 0.25 to 0.5
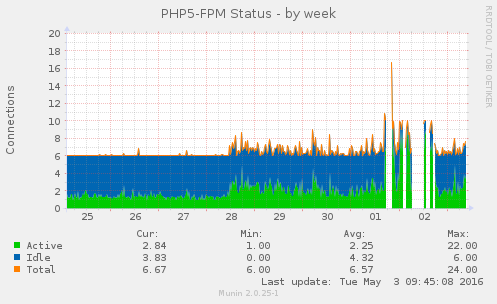
The load was into the 40's and there were more php-fpm processes than the server could cope with so I have dropped the max to 20 from 40.
comment:4 Changed 2 years ago by chris
- Add Hours to Ticket changed from 0 to 0.25
- Total Hours changed from 0.5 to 0.75
With 20 PHP processes, this is what top looks like:
top - 19:50:23 up 32 min,  2 users,  load average: 18.26, 15.39, 13.83
Tasks: 176 total,  22 running, 154 sleeping,   0 stopped,   0 zombie
%Cpu0  : 94.0 us,  5.0 sy,  0.0 ni,  0.0 id,  0.0 wa,  0.0 hi,  0.3 si,  0.7 st
%Cpu1  : 97.3 us,  2.3 sy,  0.0 ni,  0.0 id,  0.0 wa,  0.0 hi,  0.0 si,  0.3 st
%Cpu2  : 96.0 us,  3.7 sy,  0.0 ni,  0.0 id,  0.0 wa,  0.0 hi,  0.0 si,  0.3 st
%Cpu3  : 98.0 us,  2.0 sy,  0.0 ni,  0.0 id,  0.0 wa,  0.0 hi,  0.0 si,  0.0 st
%Cpu4  : 94.7 us,  4.0 sy,  0.0 ni,  0.0 id,  0.0 wa,  0.0 hi,  0.7 si,  0.7 st
%Cpu5  : 98.3 us,  1.7 sy,  0.0 ni,  0.0 id,  0.0 wa,  0.0 hi,  0.0 si,  0.0 st
%Cpu6  : 98.0 us,  1.0 sy,  0.0 ni,  0.0 id,  0.0 wa,  0.0 hi,  0.0 si,  1.0 st
%Cpu7  : 98.0 us,  2.0 sy,  0.0 ni,  0.0 id,  0.0 wa,  0.0 hi,  0.0 si,  0.0 st
%Cpu8  : 96.3 us,  2.3 sy,  0.0 ni,  0.0 id,  0.0 wa,  0.0 hi,  0.0 si,  1.3 st
%Cpu9  : 98.0 us,  1.7 sy,  0.0 ni,  0.0 id,  0.0 wa,  0.0 hi,  0.0 si,  0.3 st
KiB Mem:   8195036 total,  6599744 used,  1595292 free,    21004 buffers
KiB Swap:  5468156 total,   221156 used,  5247000 free.   194232 cached Mem

  PID USER      PR  NI    VIRT    RES    SHR S  %CPU %MEM     TIME+ COMMAND
 4838 www-data  20   0  784644 381588  41608 R  58.5  4.7   2:05.20 php5-fpm
 4439 www-data  20   0  762856 362224  44176 R  50.2  4.4   4:59.53 php5-fpm
 4457 www-data  20   0  779944 378184  42732 R  50.2  4.6   1:36.33 php5-fpm
 4458 www-data  20   0  785860 384020  42924 R  50.2  4.7   2:17.63 php5-fpm
 4440 www-data  20   0  725964 323948  42596 R  49.9  4.0   4:30.73 php5-fpm
 4442 www-data  20   0  708808 307304  43108 R  49.9  3.7   4:14.98 php5-fpm
 4453 www-data  20   0  821012 418636  42348 R  49.9  5.1   3:08.71 php5-fpm
 4456 www-data  20   0  829796 424160  39368 R  49.9  5.2   3:24.40 php5-fpm
 3809 www-data  20   0  839544 438660  43652 R  49.5  5.4   6:51.99 php5-fpm
 4432 www-data  20   0  756408 355572  43772 R  49.5  4.3   4:43.69 php5-fpm
 4445 www-data  20   0  779200 377000  42336 R  49.5  4.6   5:15.43 php5-fpm
 3810 www-data  20   0  832100 431344  43664 R  49.2  5.3   6:58.20 php5-fpm
 4435 www-data  20   0  783936 383096  43816 R  49.2  4.7   5:47.63 php5-fpm
 4446 www-data  20   0  770784 368248  42212 R  48.2  4.5   5:06.63 php5-fpm
 4452 www-data  20   0  793988 391696  42556 R  47.9  4.8   2:49.56 php5-fpm
 5010 www-data  20   0  801108 397628  41284 R  47.9  4.9   2:45.72 php5-fpm
 4434 www-data  20   0  476628  77272  44060 R  42.9  0.9   4:17.53 php5-fpm
 3811 www-data  20   0  469872  71116  44656 R  41.9  0.9   7:19.21 php5-fpm
 5012 www-data  20   0  789556 384860  40144 R  39.9  4.7   2:24.50 php5-fpm
 4448 www-data  20   0  781128 379228  42752 R  38.6  4.6   1:50.39 php5-fpm
  511 memcache  20   0  381224  35596    628 S   1.7  0.4   0:46.76 memcached
Each process is using half a CPU and the server is totally maxed out, but it is not running out of RAM and locking up.
comment:5 Changed 2 years ago by chris
- Add Hours to Ticket changed from 0 to 0.25
- Total Hours changed from 0.75 to 1.0
This is the error in the /var/log/php/error.log:
[01-May-2016 20:52:49 Europe/London] PHP Fatal error: Allowed memory size of 402653184 bytes exhausted (tried to allocate 349943 bytes) in /var/www/prod/docroot/includes/theme.inc on line 1520
The setting in /etc/php5/fpm/php.in:
memory_limit = 384M
So increasing that to 512M and further reducing the max processes to 10, one per CPU to see if that helps... I'll return to this in a while...
comment:6 Changed 2 years ago by chris
- Add Hours to Ticket changed from 0 to 0.1
- Total Hours changed from 1.0 to 1.1
top now shows each php process using all the resources of one CPU:
  PID USER      PR  NI    VIRT    RES    SHR S  %CPU %MEM     TIME+ COMMAND
 7672 www-data  20   0  785300 384812  44060 R  99.9  4.7   2:25.08 php5-fpm
 7675 www-data  20   0  704188 303196  43600 R  99.9  3.7   3:46.35 php5-fpm
 7679 www-data  20   0  778964 378232  43704 R  99.9  4.6   4:14.94 php5-fpm
 8296 www-data  20   0  792168 390452  42808 R  99.9  4.8   2:29.35 php5-fpm
 7673 www-data  20   0  766316 365744  43908 R  99.6  4.5   4:16.09 php5-fpm
 7678 www-data  20   0  754704 354000  43872 R  99.6  4.3   4:03.10 php5-fpm
 8295 www-data  20   0  830320 429028  43160 R  99.6  5.2   3:04.82 php5-fpm
 8299 www-data  20   0  817456 415284  42456 R  97.3  5.1   2:44.91 php5-fpm
 7676 www-data  20   0  471628  72180  43888 R  82.0  0.9   3:39.75 php5-fpm
 8301 www-data  20   0  781236 378376  41724 R  75.7  4.6   1:42.88 php5-fpm
Something isn't right, but with these settings the server should stay up...
comment:7 Changed 2 years ago by chris
However clients are going to find it very slow, if they can get pages to load at all...
Changed 2 years ago by chris
Changed 2 years ago by chris
comment:8 Changed 2 years ago by chris
- Add Hours to Ticket changed from 0 to 0.4
- Total Hours changed from 1.1 to 1.5
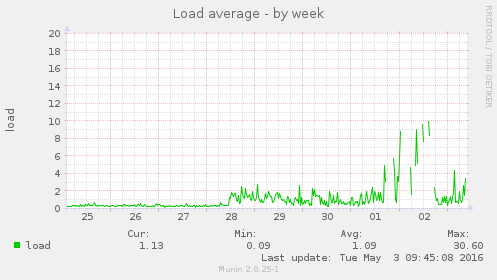
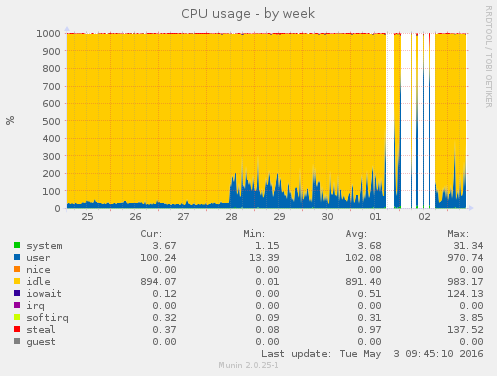
The problems with Crin2 are on going. It isn't clear to me if the problem is external, a DDOS or internal, due to changes made to the server. Looking at the munin graphs a few things are clear, the increase in CPU usage:
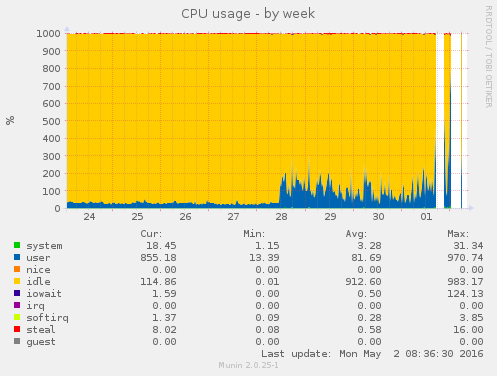
Started on the 28th April, the same day that php was upgraded, see ticket:17#comment:84 but then something else changed yesterday.
Looking at the traffic graph there is no change since 28th:
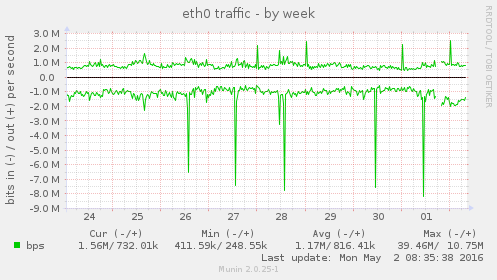
And I spent a fair mount of time looking at log files yesterday and didn't see anything that looked like a DDOS, so investigating what changed with the latest version of PHP seems like the most sensible option.
comment:9 Changed 2 years ago by chris
- Add Hours to Ticket changed from 0 to 0.3
- Total Hours changed from 1.5 to 1.8
The PHP update was an upgrade to a new version:
Package        : php5
CVE ID         : CVE-2015-8865 CVE-2016-4070 CVE-2016-4071 CVE-2016-4072
                 CVE-2016-4073

Several vulnerabilities were found in PHP, a general-purpose scripting
language commonly used for web application development.

The vulnerabilities are addressed by upgrading PHP to the new upstream
version 5.6.20, which includes additional bug fixes. Please refer to the
upstream changelog for more information:

 https://php.net/ChangeLog-5.php#5.6.20
But I can't see any obvious change in 5.6.20 that could cause this, I have also spent some time searching for other people reporting problems like this but not found anything.
It is still the case that each of the 10 CPUs is maxed out running one php-fpm process:
top - 09:26:02 up 14:08,  2 users,  load average: 9.93, 9.84, 8.68
Tasks: 166 total,  11 running, 155 sleeping,   0 stopped,   0 zombie
%Cpu0  : 86.2 us,  5.4 sy,  0.0 ni,  4.4 id,  0.0 wa,  0.0 hi,  1.0 si,  3.0 st
%Cpu1  : 97.7 us,  2.3 sy,  0.0 ni,  0.0 id,  0.0 wa,  0.0 hi,  0.0 si,  0.0 st
%Cpu2  : 82.6 us,  4.4 sy,  0.0 ni,  7.4 id,  0.0 wa,  0.0 hi,  0.3 si,  5.4 st
%Cpu3  : 98.7 us,  1.0 sy,  0.0 ni,  0.0 id,  0.0 wa,  0.0 hi,  0.0 si,  0.3 st
%Cpu4  : 99.0 us,  1.0 sy,  0.0 ni,  0.0 id,  0.0 wa,  0.0 hi,  0.0 si,  0.0 st
%Cpu5  : 98.7 us,  1.0 sy,  0.0 ni,  0.0 id,  0.0 wa,  0.0 hi,  0.0 si,  0.3 st
%Cpu6  : 98.0 us,  2.0 sy,  0.0 ni,  0.0 id,  0.0 wa,  0.0 hi,  0.0 si,  0.0 st
%Cpu7  : 97.3 us,  2.0 sy,  0.0 ni,  0.0 id,  0.0 wa,  0.0 hi,  0.3 si,  0.3 st
%Cpu8  : 96.0 us,  1.3 sy,  0.0 ni,  0.7 id,  0.0 wa,  0.0 hi,  0.0 si,  2.0 st
%Cpu9  : 98.7 us,  1.3 sy,  0.0 ni,  0.0 id,  0.0 wa,  0.0 hi,  0.0 si,  0.0 st
KiB Mem:   8195036 total,  6485568 used,  1709468 free,   103096 buffers
KiB Swap:  5468156 total,   113324 used,  5354832 free.  2092452 cached Mem

  PID USER      PR  NI    VIRT    RES    SHR S  %CPU %MEM     TIME+ COMMAND
23021 www-data  20   0  838656 437892  43752 R 100.0  5.3  30:30.32 php5-fpm
24783 www-data  20   0  773732 376160  46932 R 100.0  4.6  28:02.84 php5-fpm
25912 www-data  20   0  760132 358800  43176 R 100.0  4.4  20:31.17 php5-fpm
22998 www-data  20   0  779632 381988  47124 R  99.7  4.7  29:10.94 php5-fpm
24779 www-data  20   0  784840 387256  46932 R  99.7  4.7  28:51.75 php5-fpm
25915 www-data  20   0  831636 433900  46804 R  99.7  5.3  19:34.65 php5-fpm
23573 www-data  20   0  801212 403916  47120 R  99.1  4.9  30:01.61 php5-fpm
24784 www-data  20   0  846224 448116  46868 R  99.1  5.5  27:21.50 php5-fpm
25947 www-data  20   0  700000 302520  46868 R  94.1  3.7  19:56.54 php5-fpm
24780 www-data  20   0  781664 383980  46804 R  91.4  4.7  28:32.48 php5-fpm
  511 memcache  20   0  741488 408448    628 S   2.0  5.0   9:35.51 memcached
comment:10 Changed 2 years ago by chris
- Add Hours to Ticket changed from 0 to 0.1
- Total Hours changed from 1.8 to 1.9
I have sent out a email about this issue in case anyone wants to be added as a CC for this ticket.
comment:11 Changed 2 years ago by chris
- Add Hours to Ticket changed from 0 to 0.55
- Cc peter added
- Total Hours changed from 1.9 to 2.45
I have added Peter as a Cc for this ticket, he asked in a email "What version of Php were we on before?".
The server is running Debian Jessie and the packaged version of PHP, currently this is PHP 5.6.20, looking at the /root/Changelog file on the server the last PHP update was on 2016-04-03, with the update to Jessie 8.4, see ticket:17#comment:78, so doing a zgrep on the files listing the contents of the Debian 8.4 DVDs we have:
zgrep php5-fpm *
debian-8.4.0-amd64-DVD-2.list.gz:php5-fpm_5.6.19+dfsg-0+deb8u1_amd64.deb
So the answer is PHP 5.6.19 and this package is available at snapshot.debian.org.
comment:12 Changed 2 years ago by chris
- Add Hours to Ticket changed from 0 to 1.01
- Total Hours changed from 2.45 to 3.46
Looking for other people with this issue, searching the issues queue doesn't work, but browsing the open issues does result in people with the same problem:
I have posted a comment to that thread.
Looking at the PHP packages the server has installed:
aptitude search php | grep ^i | grep -i php
i A dh-php5                         - debhelper add-on to handle PHP PECL extens
i   newrelic-php5                   - The New Relic agent for PHP
i A newrelic-php5-common            - Scripts and samples for the New Relic PHP
i A php-console-table               - Library that makes it easy to build consol
i   php-pear                        - PEAR - PHP Extension and Application Repos
i   php5                            - server-side, HTML-embedded scripting langu
i A php5-cli                        - command-line interpreter for the php5 scri
i A php5-common                     - Common files for packages built from the p
i   php5-curl                       - CURL module for php5
i   php5-dev                        - Files for PHP5 module development
i   php5-fpm                        - server-side, HTML-embedded scripting langu
i   php5-gd                         - GD module for php5
i   php5-imagick                    - Provides a wrapper to the ImageMagick libr
i   php5-intl                       - internationalisation module for php5
i A php5-json                       - JSON module for php5
i   php5-memcache                   - memcache extension module for PHP5
i   php5-memcached                  - memcached extension module for PHP5, uses
i   php5-mysql                      - MySQL module for php5
i A php5-readline                   - Readline module for php5
i A pkg-php-tools                   - various packaging tools and scripts for PH
So if we want to downgrade PHP we will need these files:
http://snapshot.debian.org/archive/debian/20160325T044307Z/pool/main/p/php5/php-pear_5.6.19%2Bdfsg-0%2Bdeb8u1_all.deb
http://snapshot.debian.org/archive/debian/20160325T044307Z/pool/main/p/php5/php5_5.6.19%2Bdfsg-0%2Bdeb8u1_all.deb
http://snapshot.debian.org/archive/debian/20160325T044307Z/pool/main/p/php5/php5-cli_5.6.19%2Bdfsg-0%2Bdeb8u1_amd64.deb
http://snapshot.debian.org/archive/debian/20160325T044307Z/pool/main/p/php5/php5-common_5.6.19%2Bdfsg-0%2Bdeb8u1_amd64.deb
http://snapshot.debian.org/archive/debian/20160325T044307Z/pool/main/p/php5/php5-curl_5.6.19%2Bdfsg-0%2Bdeb8u1_amd64.deb
http://snapshot.debian.org/archive/debian/20160325T044307Z/pool/main/p/php5/php5-dev_5.6.19%2Bdfsg-0%2Bdeb8u1_amd64.deb
http://snapshot.debian.org/archive/debian/20160325T044307Z/pool/main/p/php5/php5-fpm_5.6.19%2Bdfsg-0%2Bdeb8u1_amd64.deb
http://snapshot.debian.org/archive/debian/20160325T044307Z/pool/main/p/php5/php5-gd_5.6.19%2Bdfsg-0%2Bdeb8u1_amd64.deb
http://snapshot.debian.org/archive/debian/20160325T044307Z/pool/main/p/php5/php5-intl_5.6.19%2Bdfsg-0%2Bdeb8u1_amd64.deb
http://snapshot.debian.org/archive/debian/20160325T044307Z/pool/main/p/php5/php5-mysql_5.6.19%2Bdfsg-0%2Bdeb8u1_amd64.deb
http://snapshot.debian.org/archive/debian/20160325T044307Z/pool/main/p/php5/php5-readline_5.6.19%2Bdfsg-0%2Bdeb8u1_amd64.deb
And the commands to run to downgrade would be:
aptitude remove php-pear php5 php5-cli php5-common php5-curl php5-dev php5-fpm php5-gd php5-intl php5-mysql php5-readline
dpkg -i /root/php5/php5_5.6.19+dfsg-0+deb8u1_all.deb /root/php5/php5-cli_5.6.19+dfsg-0+deb8u1_amd64.deb /root/php5/php5-common_5.6.19+dfsg-0+deb8u1_amd64.deb /root/php5/php5-curl_5.6.19+dfsg-0+deb8u1_amd64.deb /root/php5/php5-dev_5.6.19+dfsg-0+deb8u1_amd64.deb /root/php5/php5-fpm_5.6.19+dfsg-0+deb8u1_amd64.deb /root/php5/php5-gd_5.6.19+dfsg-0+deb8u1_amd64.deb /root/php5/php5-intl_5.6.19+dfsg-0+deb8u1_amd64.deb /root/php5/php5-mysql_5.6.19+dfsg-0+deb8u1_amd64.deb /root/php5/php-pear_5.6.19+dfsg-0+deb8u1_all.deb
I think this is probably something that we are going to have to do.
comment:13 Changed 2 years ago by chris
- Add Hours to Ticket changed from 0 to 0.25
- Total Hours changed from 3.46 to 3.71
So stopping php5-fpm and downgrading:
service php5-fpm stop
aptitude remove php-pear php5 php5-cli php5-common php5-curl php5-dev php5-fpm php5-gd php5-intl php5-mysql php5-readline


The following actions will resolve these dependencies:

     Remove the following packages:
1)     drush
2)     php-console-table
3)     php5-imagick
4)     php5-json
5)     php5-memcache
6)     php5-memcached
7)     pkg-php-tools

     Leave the following dependencies unresolved:
8)     drush recommends php5-mysql | php5-pgsql


Accept this solution? [Y/n/q/?] y

The following packages will be REMOVED:
  dh-php5{u} drush{a} imagemagick-common{u} libapparmor1{u} libfftw3-double3{u} liblqr-1-0{u} libmagickcore-6.q16-2{u} libmagickwand-6.q16-2{u}
  libmemcached11{u} libmemcachedutil2{u} libonig2{u} libpcre3-dev{u} libpcrecpp0{u} libqdbm14{u} libssl-dev{u} libssl-doc{u} php-console-table{a}
  php-pear php5 php5-cli php5-common php5-curl php5-dev php5-fpm php5-gd php5-imagick{a} php5-intl php5-json{a} php5-memcache{a}
  php5-memcached{a} php5-mysql php5-readline pkg-php-tools{a} shtool{u} ttf-dejavu-core{u} zlib1g-dev{u}
0 packages upgraded, 0 newly installed, 36 to remove and 0 not upgraded.
Need to get 0 B of archives. After unpacking 50.9 MB will be freed.

dpkg -i /root/php5/php5_5.6.19+dfsg-0+deb8u1_all.deb /root/php5/php5-cli_5.6.19+dfsg-0+deb8u1_amd64.deb /root/php5/php5-common_5.6.19+dfsg-0+deb8u1_amd64.deb /root/php5/php5-curl_5.6.19+dfsg-0+deb8u1_amd64.deb /root/php5/php5-dev_5.6.19+dfsg-0+deb8u1_amd64.deb /root/php5/php5-fpm_5.6.19+dfsg-0+deb8u1_amd64.deb /root/php5/php5-gd_5.6.19+dfsg-0+deb8u1_amd64.deb /root/php5/php5-intl_5.6.19+dfsg-0+deb8u1_amd64.deb /root/php5/php5-mysql_5.6.19+dfsg-0+deb8u1_amd64.deb /root/php5/php-pear_5.6.19+dfsg-0+deb8u1_all.deb

aptitude install dh-php5 drush imagemagick-common libapparmor1 libfftw3-double3 liblqr-1-0 libmagickcore-6.q16-2 libmagickwand-6.q16-2 libmemcached11 libmemcachedutil2 libonig2 libpcre3-dev libpcrecpp0 libqdbm14 libssl-dev libssl-doc php-console-table php5-imagick php5-json php5-memcache php5-memcached pkg-php-tools shtool ttf-dejavu-core zlib1g-dev
Checking which version we are now running:
php5-fpm --version
PHP 5.6.19-0+deb8u1 (fpm-fcgi) (built: Mar 14 2016 10:22:11)
Copyright (c) 1997-2016 The PHP Group
Zend Engine v2.6.0, Copyright (c) 1998-2016 Zend Technologies
    with Zend OPcache v7.0.6-dev, Copyright (c) 1999-2016, by Zend Technologies
And the site is up and running, I'll check on the Munin graphs later to see if this has solved the issue.
comment:14 Changed 2 years ago by chris
- Add Hours to Ticket changed from 0 to 0.15
- Total Hours changed from 3.71 to 3.86
The munin graphs for crin2 look fine now, the downgrade has solved this problem, but it would be good to get to the root of it so it can be addressed. Perhaps we can so some testing on the dev server as that is running the latest Debian Jessie PHP (but note that the issue with the CSS and image URLs hasn't been resolved on that site yet).
comment:15 Changed 2 years ago by chris
- Add Hours to Ticket changed from 0 to 0.1
- Total Hours changed from 3.86 to 3.96
I have posted a follow up to the Drupal issue.
Changed 2 years ago by chris
Changed 2 years ago by chris
Changed 2 years ago by chris
Changed 2 years ago by chris
Changed 2 years ago by chris
Changed 2 years ago by chris
comment:16 Changed 2 years ago by chris
- Add Hours to Ticket changed from 0 to 0.25
- Total Hours changed from 3.96 to 4.21
Looking at the Munin graphs it is clear that the server hasn't returned to how it was before 28th April, rather it is running as it was from 28th April to 1st May, before it ran out of RAM and oomkiller took out php5-fpm due to lack of memory:

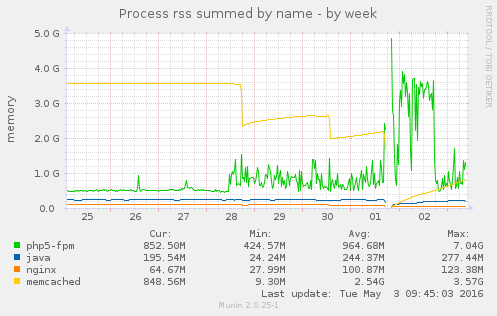
I don't know what the cause of this is, the only thing that I can think of that is different now from before 28th is that each php5-fpm process has a higher max memory limit and also the max total number of php5-fpm processes is now capped at 10 rather than 30.
Peter are you going to be able to look at the issue with PHP 5.6.20? If you are able to spend some time on this job then if would be great if you could also look at the issues holding up the implementation of Nginx caching, see ticket:56#comment:8.
comment:17 Changed 2 years ago by chris
- Add Hours to Ticket changed from 0 to 0.3
- Total Hours changed from 4.21 to 4.51
The security patches that we are missing by running PHP 5.6.19 rather than PHP 5.6.20:
- CVE-2015-8865 Buffer over-write in finfo_open with malformed magic file
- CVE-2016-4070 Integer overflow in php_raw_url_encode
- CVE-2016-4071 Format string vulnerability in php_snmp_error()
- CVE-2016-4072 Invalid memory write in phar on filename containing \0 inside name
- CVE-2016-4073 Negative size parameter in memcpy
I'm not sure if any of the above have a direct impact on us? I'm also wondering if we should raise an issue on the PHP bug tracker -- I can't see any reports of issues like the one we have...
comment:18 Changed 2 years ago by chris
- Add Hours to Ticket changed from 0 to 0.3
- Total Hours changed from 4.51 to 4.81
I have spent some time trying, again, to find other people with this issue, but haven't found any. I have also spent some time looking at the Munin graphs and there isn't anything further to report. I can't think of anything further I can do on this issue -- I think it's over to Peter to investigate if there is an issue with Drupal 7 and PHP 5.6.20?
comment:19 Changed 2 years ago by chris
- Add Hours to Ticket changed from 0 to 0.25
- Total Hours changed from 4.81 to 5.06
This problem hasn't been solved by downgrading PHP, currently top is displaying all 10 CPUs maxed out by 10 php5-fpm processes:
top - 09:43:18 up 5 days, 14:25,  1 user,  load average: 9.88, 6.77, 3.48
Tasks: 158 total,  11 running, 147 sleeping,   0 stopped,   0 zombie
%Cpu0  : 87.5 us,  3.0 sy,  0.0 ni,  7.1 id,  0.0 wa,  0.0 hi,  1.0 si,  1.3 st
%Cpu1  : 89.7 us,  2.7 sy,  0.0 ni,  5.7 id,  0.0 wa,  0.0 hi,  0.3 si,  1.7 st
%Cpu2  : 97.7 us,  1.3 sy,  0.0 ni,  0.7 id,  0.0 wa,  0.0 hi,  0.0 si,  0.3 st
%Cpu3  : 98.0 us,  2.0 sy,  0.0 ni,  0.0 id,  0.0 wa,  0.0 hi,  0.0 si,  0.0 st
%Cpu4  : 97.3 us,  1.7 sy,  0.0 ni,  0.7 id,  0.0 wa,  0.0 hi,  0.0 si,  0.3 st
%Cpu5  : 95.0 us,  3.3 sy,  0.0 ni,  0.0 id,  0.0 wa,  0.0 hi,  0.7 si,  1.0 st
%Cpu6  : 98.0 us,  2.0 sy,  0.0 ni,  0.0 id,  0.0 wa,  0.0 hi,  0.0 si,  0.0 st
%Cpu7  : 98.3 us,  1.3 sy,  0.0 ni,  0.0 id,  0.0 wa,  0.0 hi,  0.0 si,  0.3 st
%Cpu8  : 99.0 us,  0.7 sy,  0.0 ni,  0.0 id,  0.0 wa,  0.0 hi,  0.0 si,  0.3 st
%Cpu9  : 98.0 us,  1.7 sy,  0.0 ni,  0.0 id,  0.0 wa,  0.0 hi,  0.0 si,  0.3 st
KiB Mem:   8195036 total,  7836716 used,   358320 free,   115732 buffers
KiB Swap:  5468156 total,    49268 used,  5418888 free.  1519508 cached Mem

  PID USER      PR  NI    VIRT    RES    SHR S  %CPU %MEM     TIME+ COMMAND
24179 www-data  20   0  760992 373920  48804 R 100.0  4.6   8:10.75 php5-fpm
24311 www-data  20   0  782460 395368  48804 R 100.0  4.8   6:45.16 php5-fpm
27184 www-data  20   0  835316 442928  42584 R 100.0  5.4   5:29.85 php5-fpm
23731 www-data  20   0  778704 391540  48868 R  99.8  4.8   6:59.10 php5-fpm
27186 www-data  20   0  829924 438256  43096 R  99.8  5.3   5:24.43 php5-fpm
27185 www-data  20   0  770056 377248  43288 R  99.5  4.6   4:57.87 php5-fpm
23730 www-data  20   0  809332 422148  48804 R  99.1  5.2  12:14.74 php5-fpm
27187 www-data  20   0  764796 372432  43544 R  97.8  4.5   4:52.26 php5-fpm
26627 www-data  20   0  771840 379592  43736 R  94.5  4.6   5:16.24 php5-fpm
23729 www-data  20   0  772684 380652  43928 R  92.1  4.6   9:06.67 php5-fpm
  511 memcache  20   0 2519008 2.126g    596 S   2.3 27.2  48:37.84 memcached
Peter were any Drupal code updates applied on 28th April 2016 -- this is when the change in the behaviour of the server changed.
I'll also send a email to 1984.is to see if they are aware of any changes that happened on that day.
comment:20 Changed 2 years ago by chris
- Add Hours to Ticket changed from 0 to 0.3
- Total Hours changed from 5.06 to 5.36
I have just sent this email to https://1984.is/
Date: Mon, 9 May 2016 10:46:57 +0100
From: Chris Croome <chris@webarchitects.co.uk>
To: 1984@1984.is
Subject: Load issues with the CRIN2 server
Message-ID: <20160509094657.GG2824@webarchitects.co.uk>

We have been having some issues with the CRIN2 virtual server, the
details are documented on this ticket:

- https://trac.crin.org.archived.website/trac/ticket/73

Since 28th April the CPU usage of php5-fpm has very dramatically
increased, this is illustrated here:

- https://munin.crin.org/munin/crin.org/crin2.crin.org/cpu.html

There was an update to php on that day however I have since downgraded
php to the previous version and yet the issue persists.

I don't know of any changes to the Drupal code running the site which
could have caused this and I don't see an increase in the bandwidth so I
don't think there is an external cause:

- https://munin.crin.org/munin/crin.org/crin2.crin.org/if_eth0.html

I have no reason this think that the cause is anything to do with you but
was wanting to check if you could think of any reason for this change
in behaviour as I'm at a loss to explain it.
comment:21 Changed 2 years ago by chris
- Add Hours to Ticket changed from 0 to 0.1
- Total Hours changed from 5.36 to 5.46
Suggestions from 1984.is:
I'd look into what is logging, and if the php log is not enabled, enable it and increase debug level. I'd also check one of the heavy php process with strace -p 1234 to see what the hell it is doing, It may also be helpful to test a vanilla setup of drupal to determine if this a php issue or a drupal issue. Then if you are feeling brave you could try out php7 from https://www.dotdeb.org/2016/04/29/php-7-0-6-for-jessie/ you can even try it without removing php5. Also have you checked dmesg and run a check on the filesystem?
If everything fails you may want to setup a new CRIN2 server, you can run it on a different IP on a different hardware, and when you are happy with the setup we can kill the old one. There is no extra charge in doing this, just know it is an option.
There was a load spike just now, but it has passed, next time there is one I'll try a strace on one of the php5-fpm processes which is using 100% of the CPU. For some of the the other options I'd need some input from Peter...
comment:22 follow-up: ↓ 23 Changed 2 years ago by chris
- Add Hours to Ticket changed from 0 to 0.25
- Total Hours changed from 5.46 to 5.71
Doing some regular updates on the server I accidentally upgraded php, to downgrade it again:
aptitude remove php-pear php5 php5-cli php5-common php5-curl php5-dev php5-fpm php5-gd php5-intl php5-mysql php5-readline
dpkg -i /root/php5/php5_5.6.19+dfsg-0+deb8u1_all.deb /root/php5/php5-cli_5.6.19+dfsg-0+deb8u1_amd64.deb /root/php5/php5-common_5.6.19+dfsg-0+deb8u1_amd64.deb /root/php5/php5-curl_5.6.19+dfsg-0+deb8u1_amd64.deb /root/php5/php5-dev_5.6.19+dfsg-0+deb8u1_amd64.deb /root/php5/php5-fpm_5.6.19+dfsg-0+deb8u1_amd64.deb /root/php5/php5-gd_5.6.19+dfsg-0+deb8u1_amd64.deb /root/php5/php5-intl_5.6.19+dfsg-0+deb8u1_amd64.deb /root/php5/php5-mysql_5.6.19+dfsg-0+deb8u1_amd64.deb /root/php5/php-pear_5.6.19+dfsg-0+deb8u1_all.deb
aptitude install php5-json
dpkg --configure -a
/etc/init.d/php5-fpm start
Sorry for the downtime this caused.
Peter I'd really appreciate it if you could help resolving the issues we are having with php when you have time.
comment:23 in reply to: ↑ 22 Changed 2 years ago by chris
- Add Hours to Ticket changed from 0 to 0.25
- Total Hours changed from 5.71 to 5.96
Replying to chris:
Doing some regular updates on the server I accidentally upgraded php, to downgrade it again:
aptitude remove php-pear php5 php5-cli php5-common php5-curl php5-dev php5-fpm php5-gd php5-intl php5-mysql php5-readline
dpkg -i /root/php5/php5_5.6.19+dfsg-0+deb8u1_all.deb /root/php5/php5-cli_5.6.19+dfsg-0+deb8u1_amd64.deb /root/php5/php5-common_5.6.19+dfsg-0+deb8u1_amd64.deb /root/php5/php5-curl_5.6.19+dfsg-0+deb8u1_amd64.deb /root/php5/php5-dev_5.6.19+dfsg-0+deb8u1_amd64.deb /root/php5/php5-fpm_5.6.19+dfsg-0+deb8u1_amd64.deb /root/php5/php5-gd_5.6.19+dfsg-0+deb8u1_amd64.deb /root/php5/php5-intl_5.6.19+dfsg-0+deb8u1_amd64.deb /root/php5/php5-mysql_5.6.19+dfsg-0+deb8u1_amd64.deb /root/php5/php-pear_5.6.19+dfsg-0+deb8u1_all.deb
aptitude install php5-json
dpkg --configure -a
/etc/init.d/php5-fpm start
The steps above omitted memcache, it should have been:
aptitude remove php-pear php5 php5-cli php5-common php5-curl php5-dev php5-fpm php5-gd php5-intl php5-mysql php5-readline
dpkg -i /root/php5/php5_5.6.19+dfsg-0+deb8u1_all.deb /root/php5/php5-cli_5.6.19+dfsg-0+deb8u1_amd64.deb /root/php5/php5-common_5.6.19+dfsg-0+deb8u1_amd64.deb /root/php5/php5-curl_5.6.19+dfsg-0+deb8u1_amd64.deb /root/php5/php5-dev_5.6.19+dfsg-0+deb8u1_amd64.deb /root/php5/php5-fpm_5.6.19+dfsg-0+deb8u1_amd64.deb /root/php5/php5-gd_5.6.19+dfsg-0+deb8u1_amd64.deb /root/php5/php5-intl_5.6.19+dfsg-0+deb8u1_amd64.deb /root/php5/php5-mysql_5.6.19+dfsg-0+deb8u1_amd64.deb /root/php5/php-pear_5.6.19+dfsg-0+deb8u1_all.deb
aptitude install php5-json php5-memcache php5-memcached
dpkg --configure -a
/etc/init.d/php5-fpm start
comment:24 Changed 2 years ago by chris
- Add Hours to Ticket changed from 0 to 0.25
- Total Hours changed from 5.96 to 6.21
A few moments ago a php5-fpm process was using a lot of CPU so I installed strace and did a strace -c -p on the process id and got this:
 strace -c -p  9514
Process 9514 attached
% time     seconds  usecs/call     calls    errors syscall
------ ----------- ----------- --------- --------- ----------------
 96.51    0.024016           0    247849           gettimeofday
  2.20    0.000548           1       962           recvfrom
  0.39    0.000098           4        23           write
  0.29    0.000073           0       573           sendto
  0.25    0.000063           0       378           poll
  0.20    0.000049           0       495        30 access
  0.15    0.000038           0       376           ioctl
  0.00    0.000000           0        52         1 read
  0.00    0.000000           0        21           open
  0.00    0.000000           0        37           close
  0.00    0.000000           0       181        15 stat
  0.00    0.000000           0        16           fstat
  0.00    0.000000           0        10         4 lstat
  0.00    0.000000           0        14           lseek
  0.00    0.000000           0        16           mmap
  0.00    0.000000           0        69           munmap
  0.00    0.000000           0         1           brk
  0.00    0.000000           0         3           rt_sigaction
  0.00    0.000000           0         3           rt_sigprocmask
  0.00    0.000000           0         1           rt_sigreturn
  0.00    0.000000           0       376           select
  0.00    0.000000           0        12           setitimer
  0.00    0.000000           0         6           socket
  0.00    0.000000           0         5         5 connect
  0.00    0.000000           0         5         2 accept
  0.00    0.000000           0         5           shutdown
  0.00    0.000000           0        10           setsockopt
  0.00    0.000000           0         5           getsockopt
  0.00    0.000000           0        31           fcntl
  0.00    0.000000           0         4           getdents
  0.00    0.000000           0        45           getcwd
  0.00    0.000000           0         6           chdir
  0.00    0.000000           0        12           getrusage
  0.00    0.000000           0         6           times
  0.00    0.000000           0        19           clock_gettime
  0.00    0.000000           0         2           openat
------ ----------- ----------- --------- --------- ----------------
100.00    0.024885                251629        57 total
There are some references to other people having 20k gettimeofday calls but not 1/4 of a million... for example:
comment:25 Changed 2 years ago by chris
- Add Hours to Ticket changed from 0 to 0.1
- Total Hours changed from 6.21 to 6.31
I did a few more and this time checked the time at the start and at the end:
date ; strace -c -p 11556 ; date
Sat May 14 19:40:35 GMT 2016
Process 11556 attached
^CProcess 11556 detached
% time     seconds  usecs/call     calls    errors syscall
------ ----------- ----------- --------- --------- ----------------
100.00    0.002252           0    601854           gettimeofday
  0.00    0.000000           0        16           brk
------ ----------- ----------- --------- --------- ----------------
100.00    0.002252                601870           total
Sat May 14 19:40:49 GMT 2016


date ; strace -c -p 10973 ; date
Sat May 14 19:40:54 GMT 2016
Process 10973 attached
^CProcess 10973 detached
% time     seconds  usecs/call     calls    errors syscall
------ ----------- ----------- --------- --------- ----------------
100.00    0.006457           0    677348           gettimeofday
  0.00    0.000000           0         4           brk
------ ----------- ----------- --------- --------- ----------------
100.00    0.006457                677352           total
Sat May 14 19:41:12 GMT 2016


date ; strace -c -p 10973 ; date
Sat May 14 19:41:23 GMT 2016
Process 10973 attached
^CProcess 10973 detached
% time     seconds  usecs/call     calls    errors syscall
------ ----------- ----------- --------- --------- ----------------
 98.37    0.003860           0    264807           gettimeofday
  1.63    0.000064           6        10           recvfrom
  0.00    0.000000           0         2           brk
  0.00    0.000000           0        20           select
  0.00    0.000000           0        10           sendto
------ ----------- ----------- --------- --------- ----------------
100.00    0.003924                264849           total
Sat May 14 19:41:31 GMT 2016
So between 15 and 20 seconds for 600k gettimeofday calls made by one php5-fpm process... Peter do you have any idea what is happening here?
comment:26 Changed 2 years ago by chris
- Add Hours to Ticket changed from 0 to 0.02
- Total Hours changed from 6.31 to 6.33
1.1 million in 20 seconds...
date ; strace -c -p 10976 ; date
Sat May 14 19:46:38 GMT 2016
Process 10976 attached
^CProcess 10976 detached
% time     seconds  usecs/call     calls    errors syscall
------ ----------- ----------- --------- --------- ----------------
100.00    0.001330           0   1104009           gettimeofday
  0.00    0.000000           0        25           brk
------ ----------- ----------- --------- --------- ----------------
100.00    0.001330               1104034           total
Sat May 14 19:46:58 GMT 2016
comment:27 Changed 2 years ago by chris
- Add Hours to Ticket changed from 0 to 0.26
- Total Hours changed from 6.33 to 6.59
Someone else had an issue like this and it was a profiler causing it, see https://www.bidon.ca/en/node/620 so I wonder if it could be related to the New Relic packages?
aptitude search newrelic | grep ^i
i A newrelic-daemon                 - The New Relic proxy daemon
i   newrelic-php5                   - The New Relic agent for PHP
i A newrelic-php5-common            - Scripts and samples for the New Relic PHP
i   newrelic-sysmond                - The New Relic agent for server monitoring

ps -lA | grep newrelic
4 S     0  9507     1  0  80   0 - 110727 -     ?        00:00:00 newrelic-daemon
4 S     0  9536  9507  0  80   0 - 84580 -      ?        00:00:03 newrelic-daemon
Trying removing them:
aptitude remove newrelic-php5 newrelic-php5-common newrelic-sysmond
/etc/init.d/php5-fpm restart
I'll look at how the Munin graphs tomorrow, from the output of top it does appear to have helped... there hasn't been a php5-fpm process that has been around long enough to get any results from strace.
comment:28 Changed 2 years ago by chris
- Add Hours to Ticket changed from 0 to 0.1
- Total Hours changed from 6.59 to 6.69
Well it hasn't totally stopped the high CPU usage:
  PID USER      PR  NI    VIRT    RES    SHR S  %CPU %MEM     TIME+ COMMAND
18692 www-data  20   0  792192 430640  43344 R 100.0  5.3   2:48.27 php5-fpm
18687 www-data  20   0  768324 406800  43668 R 100.0  5.0   2:17.97 php5-fpm
18691 www-data  20   0  436064  76288  44036 S  16.9  0.9   2:50.72 php5-fpm
But it is no longer gettimeofday that is the top call:
date ; strace -c -p 19292 ; date
Sat May 14 20:35:24 GMT 2016
Process 19292 attached
^CProcess 19292 detached
% time     seconds  usecs/call     calls    errors syscall
------ ----------- ----------- --------- --------- ----------------
  0.00    0.000000           0        17           stat
  0.00    0.000000           0        96           poll
  0.00    0.000000           0        89           brk
  0.00    0.000000           0        99           ioctl
  0.00    0.000000           0         1           access
  0.00    0.000000           0       124           select
  0.00    0.000000           0       159           sendto
  0.00    0.000000           0       260           recvfrom
  0.00    0.000000           0        94           gettimeofday
------ ----------- ----------- --------- --------- ----------------
100.00    0.000000                   939           total
Sat May 14 20:35:45 GMT 2016
comment:29 Changed 2 years ago by chris
I got this email:
Date: Sat, 14 May 2016 20:39:01 +0000
From: Cron Daemon <root@crin2.crin.org>
To: root@crin2.crin.org
Subject: Cron <root@crin2>   [ -x /usr/lib/php5/sessionclean ] && /usr/lib/php5/sessionclean

PHP Warning:  PHP Startup: Unable to load dynamic library '/usr/lib/php5/20131226/newrelic.so' -  /usr/lib/php5/20131226/newrelic.so: cannot open shared object file: No such file or directory in Unknown on line 0
So I moved the file out of the way and restarted:
mv /etc/php5/mods-available/newrelic.ini /root/
/etc/init.d/php5-fpm restart
comment:30 Changed 2 years ago by chris
- Add Hours to Ticket changed from 0 to 0.1
- Total Hours changed from 6.69 to 6.79
Still seeing a high CPU usage from php:
  PID USER      PR  NI    VIRT    RES    SHR S  %CPU %MEM     TIME+ COMMAND
20488 www-data  20   0  741576 377444  40996 R 100.0  4.6   1:07.34 php5-fpm
But the calls are different:
date ; strace -c -p 20488 ; date
Sat May 14 20:44:35 GMT 2016
Process 20488 attached
^CProcess 20488 detached
% time     seconds  usecs/call     calls    errors syscall
------ ----------- ----------- --------- --------- ----------------
 78.07    0.011238           2      5030           sendto
 15.11    0.002175           0      5040           select
  3.56    0.000513           0      7504           recvfrom
  2.00    0.000288           0      2495           poll
  0.79    0.000114           0      2495           gettimeofday
  0.46    0.000066           0      2495           ioctl
  0.00    0.000000           0         8           stat
  0.00    0.000000           0        82           brk
------ ----------- ----------- --------- --------- ----------------
100.00    0.014394                 25149           total
Sat May 14 20:45:11 GMT 2016
Perhaps the next thing to try is upgrading to the latest php -- perhaps there was an issue with newrelic and php...?
comment:31 Changed 2 years ago by chris
- Add Hours to Ticket changed from 0 to 0.1
- Total Hours changed from 6.79 to 6.89
So tried upgrading and still a high CPU usage:
  PID USER      PR  NI    VIRT    RES    SHR S  %CPU %MEM     TIME+ COMMAND
24538 www-data  20   0  717804 354032  41328 R  99.8  4.3   0:23.84 php5-fpm
date ; strace -c -p 24538 ; date
Sat May 14 20:49:30 GMT 2016
Process 24538 attached
^CProcess 24538 detached
% time     seconds  usecs/call     calls    errors syscall
------ ----------- ----------- --------- --------- ----------------
  0.00    0.000000           0         7           stat
  0.00    0.000000           0       177           brk
  0.00    0.000000           0        30           select
  0.00    0.000000           0        15           sendto
  0.00    0.000000           0        15           recvfrom
------ ----------- ----------- --------- --------- ----------------
100.00    0.000000                   244           total
Sat May 14 20:49:59 GMT 2016
I'll come back to this tomorrow...
Changed 2 years ago by chris
Changed 2 years ago by chris
comment:32 Changed 2 years ago by chris
- Add Hours to Ticket changed from 0 to 0.25
- Total Hours changed from 6.89 to 7.14
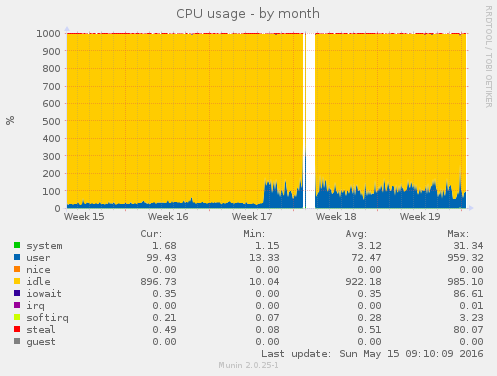
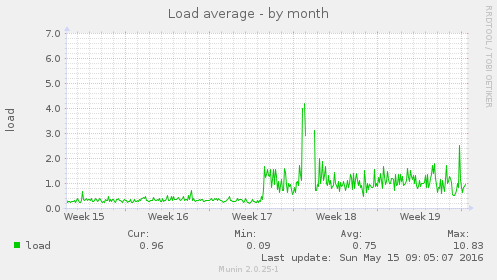
Looking at the Munin graphs above the new version of PHP hasn't made a difference in terms of getting the CPU usage back to where it was three weeks ago but the removal of New Relic does appear to have solved the very high number of gettimeofday calls, this is a strace on a php5-fpm process that wasn't using a huge amount of CPU:
date ; strace -c -p 7471 ; date
Sun May 15 09:09:59 GMT 2016
Process 7471 attached
^CProcess 7471 detached
% time     seconds  usecs/call     calls    errors syscall
------ ----------- ----------- --------- --------- ----------------
100.00    0.000346           1       479           recvfrom
  0.00    0.000000           0        23           read
  0.00    0.000000           0         5           write
  0.00    0.000000           0         7           open
  0.00    0.000000           0        12           close
  0.00    0.000000           0       105         7 stat
  0.00    0.000000           0         6           fstat
  0.00    0.000000           0        11         3 lstat
  0.00    0.000000           0       161           poll
  0.00    0.000000           0         7           lseek
  0.00    0.000000           0         6           mmap
  0.00    0.000000           0         6           munmap
  0.00    0.000000           0        89           brk
  0.00    0.000000           0         2           rt_sigaction
  0.00    0.000000           0         2           rt_sigprocmask
  0.00    0.000000           0       178           ioctl
  0.00    0.000000           0       248        13 access
  0.00    0.000000           0       226           select
  0.00    0.000000           0         7           setitimer
  0.00    0.000000           0         2           socket
  0.00    0.000000           0         2         2 connect
  0.00    0.000000           0         2           accept
  0.00    0.000000           0       277           sendto
  0.00    0.000000           0         3           shutdown
  0.00    0.000000           0         5           setsockopt
  0.00    0.000000           0         2           getsockopt
  0.00    0.000000           0        13           fcntl
  0.00    0.000000           0         2           getdents
  0.00    0.000000           0        25           getcwd
  0.00    0.000000           0         2           chdir
  0.00    0.000000           0       138           gettimeofday
  0.00    0.000000           0         4           times
  0.00    0.000000           0        12           clock_gettime
  0.00    0.000000           0         1           openat
------ ----------- ----------- --------- --------- ----------------
100.00    0.000346                  2070        25 total
Sun May 15 09:10:12 GMT 2016
I'm not sure what went wrong, looking at the munin graphs it could be that memcache ran out of memory a few days ago, I'll investigate some more on Tuesday.