Opened 21 months ago
Last modified 21 months ago
#94 new defect
Ongoing high load caused by a bot
| Reported by: | chris | Owned by: | chris |
|---|---|---|---|
| Priority: | critical | Milestone: | Maintenance |
| Component: | crin2 | Version: | |
| Keywords: | Cc: | ||
| Estimated Number of Hours: | 0 | Add Hours to Ticket: | 0 |
| Billable?: | yes | Total Hours: | 0.5 |
Description
Ticket to working out what to do with this issue...
Attachments (14)
Change History (17)
Changed 21 months ago by chris
Changed 21 months ago by chris
Changed 21 months ago by chris
Changed 21 months ago by chris
Changed 21 months ago by chris
Changed 21 months ago by chris
Changed 21 months ago by chris
Changed 21 months ago by chris
Changed 21 months ago by chris
Changed 21 months ago by chris
Changed 21 months ago by chris
Changed 21 months ago by chris
Changed 21 months ago by chris
Changed 21 months ago by chris
comment:1 Changed 21 months ago by chris
- Add Hours to Ticket changed from 0 to 0.5
- Total Hours set to 0.5
comment:2 Changed 21 months ago by chris
It is using more than one IP:
46.229.168.71 - - [15/Dec/2016:19:45:46 +0000] "GET /en/library/custom-search-legal?f%5B0%5D=field_date%3Avalue%3A%5B2013-01-01T00%3A00%3A00Z%20TO%202014-01-01T00%3A00%3A00Z%5D&f%5B1%5D=field_date%3Avalue%3A%5B1997-01-01T00%3A00%3A00Z%20TO%201998-01-01T00%3A00%3A00Z%5D&field_country=All&field_country_1=All&field_crc=All&field_instruments=All&field_monitoring_body=All&field_scope=All&field_themes=All&promo=1&search_api_language=current HTTP/1.1" 499 0 "-" "Mozilla/5.0 (compatible; SemrushBot/1.1~bl; +http://www.semrush.com/bot.html)"
So:
ipdrop 46.229.168.71
comment:3 Changed 21 months ago by chris
And a few more:
ipdrop 46.229.168.67
ipdrop 46.229.168.72
ipdrop 46.229.168.73
ipdrop 46.229.168.69
ipdrop 46.229.168.70
ipdrop 46.229.168.74
ipdrop 46.229.168.65
ipdrop 46.229.168.68
Note: See
TracTickets for help on using
tickets.
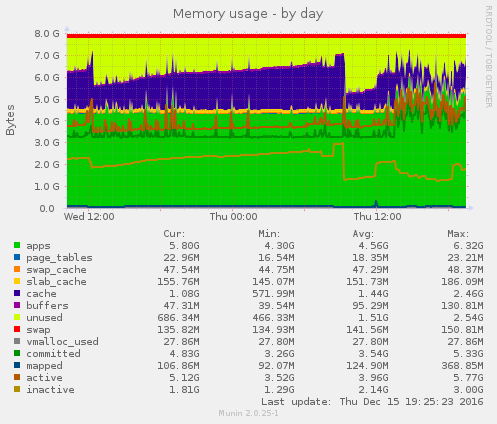
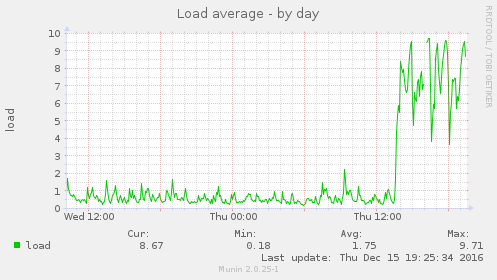
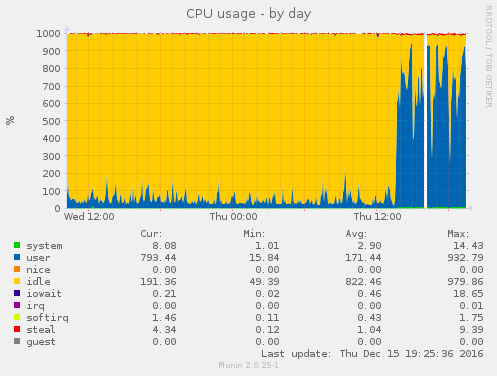
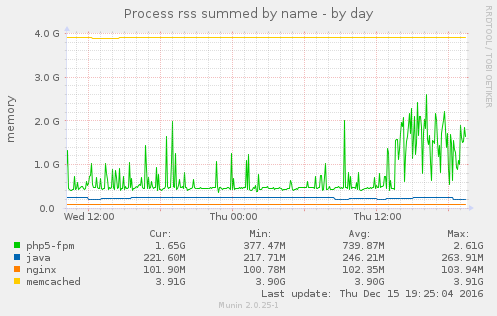
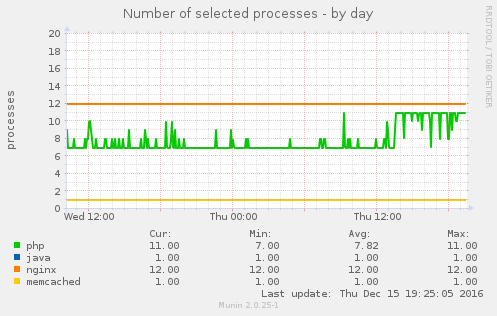
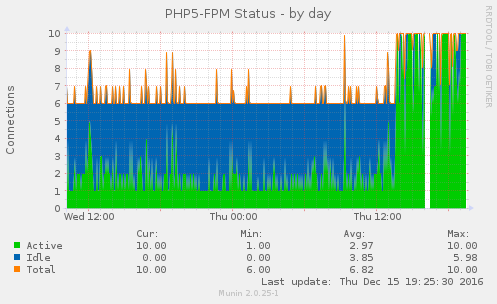
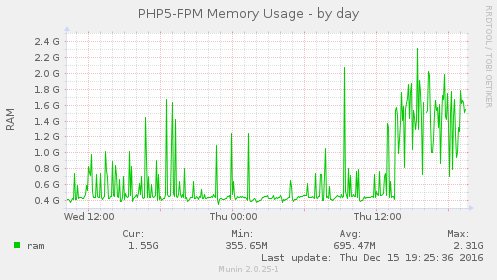
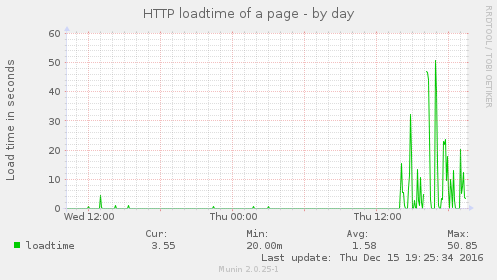
The PHP server, Crin2 is really suffering:
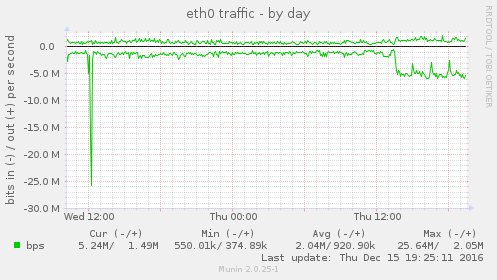
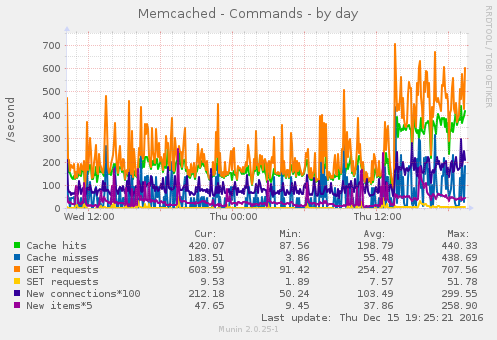
Some graphs of the ongoing high load:
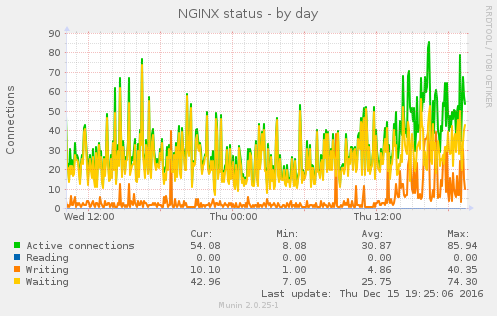
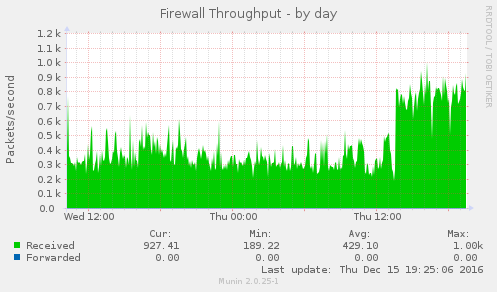
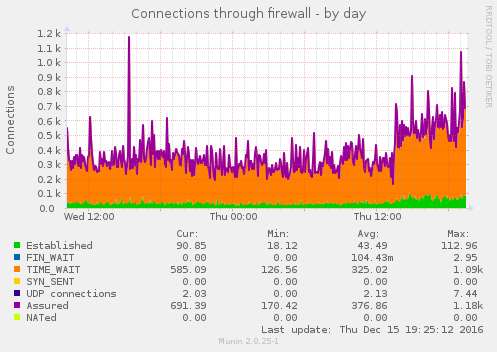
And the bot responsible:
The number of requests:
And an example request:
So we could simply block this bot, or rate limit it, notes that the reason it is generating a high load is because it is requesting searches.
At the moment we have this in /etc/nginx/nginx.conf:
And I can't see a simple way right now to add a lower rate for one IP address so using the ip tables script to block it:
And I'll check back later to see the results...