Opened 2 years ago
Closed 2 years ago
#75 closed defect (fixed)
Load spike and small downtime
| Reported by: | chris | Owned by: | chris |
|---|---|---|---|
| Priority: | major | Milestone: | Maintenance |
| Component: | crin2 | Version: | |
| Keywords: | Cc: | ||
| Estimated Number of Hours: | 0 | Add Hours to Ticket: | 0 |
| Billable?: | yes | Total Hours: | 1.2 |
Description
Since about 8:10am this morning there has been a noticeable increase in bandwidth usage and load on Crin2 and at 18:33, for 20 seconds, the Webarchitects monitoring server was unable to connect.
Attachments (17)
Change History (21)
comment:1 Changed 2 years ago by chris
- Add Hours to Ticket changed from 0 to 0.25
- Total Hours set to 0.25
Changed 2 years ago by chris
Changed 2 years ago by chris
Changed 2 years ago by chris
Changed 2 years ago by chris
Changed 2 years ago by chris
Changed 2 years ago by chris
Changed 2 years ago by chris
Changed 2 years ago by chris
Changed 2 years ago by chris
Changed 2 years ago by chris
comment:2 Changed 2 years ago by chris
- Add Hours to Ticket changed from 0 to 0.25
- Total Hours changed from 0.25 to 0.5
comment:3 Changed 2 years ago by chris
- Add Hours to Ticket changed from 0 to 0.45
- Total Hours changed from 0.5 to 0.95
The high load and increased bandwidth usage is ongoing and looking at the access logs one IP address stands out:
grep "149.202.198.122" crin.org.access.log | wc -l
36769
grep "149.202.198.122" crin.org.access.log.1 | wc -l
83084
This looks like a dynamic IP address:
dig -x 149.202.198.122 +short
ns3025239.ip-149-202-198.eu.
The total number of requests: 119,853
It is having an adverse impact on other users and after watching the logs for a while and ponding all the options I have blocked the IP address using iptables as it is basically abuse.
Changed 2 years ago by chris
Changed 2 years ago by chris
Changed 2 years ago by chris
Changed 2 years ago by chris
Changed 2 years ago by chris
Changed 2 years ago by chris
Changed 2 years ago by chris
comment:4 Changed 2 years ago by chris
- Add Hours to Ticket changed from 0 to 0.25
- Resolution set to fixed
- Status changed from new to closed
- Total Hours changed from 0.95 to 1.2
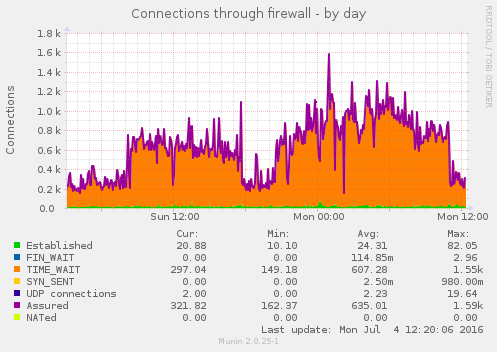
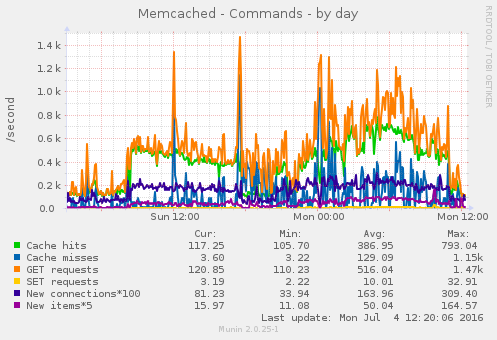
Blocking that one abusive IP address appears to have solved this issue, see these graphs:
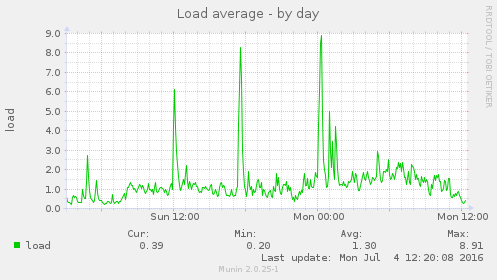
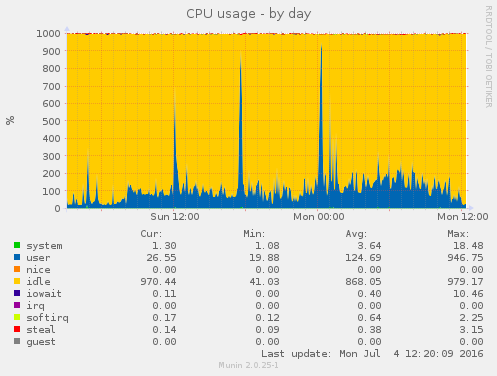
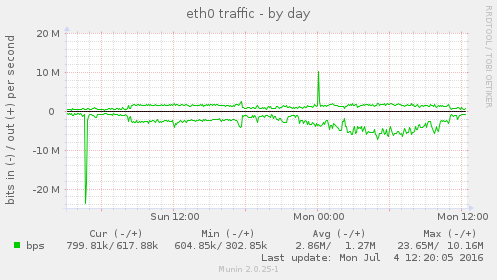
Closing this ticket.
Note: See
TracTickets for help on using
tickets.
The down email:
And the up email:
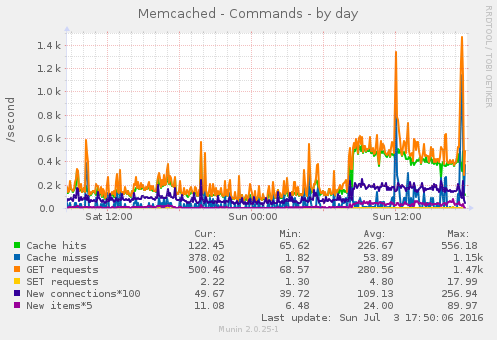
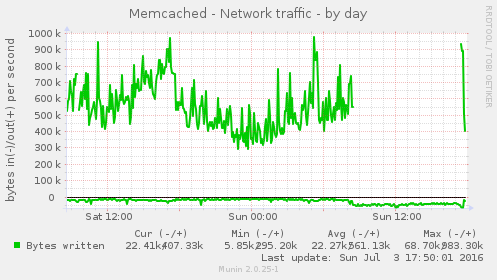
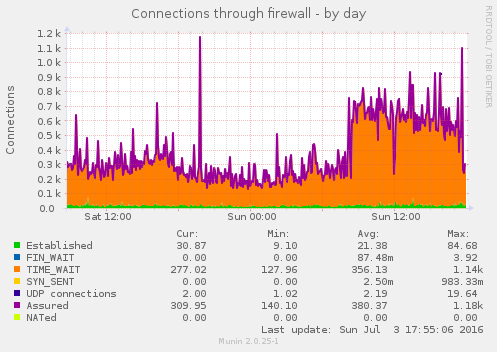
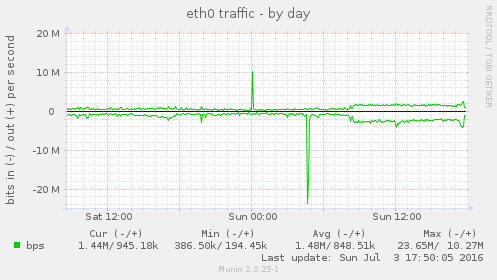
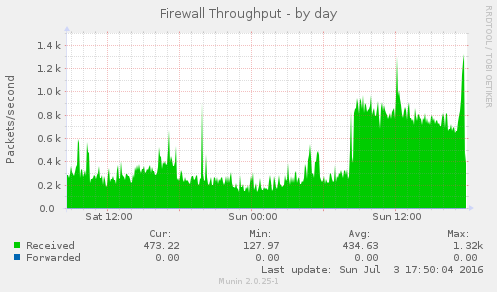
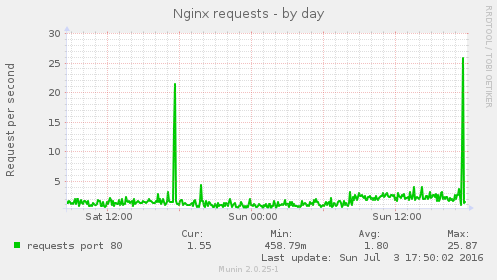
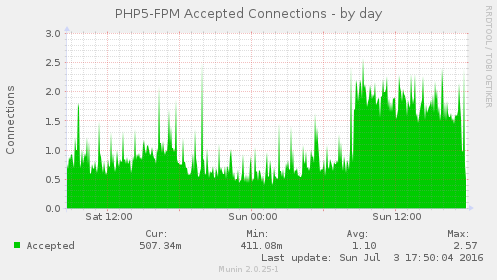
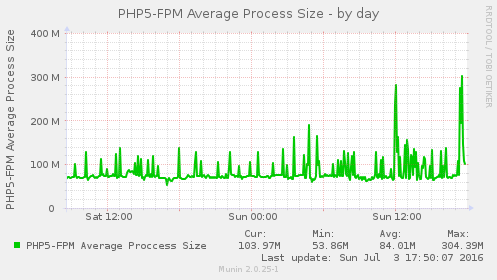
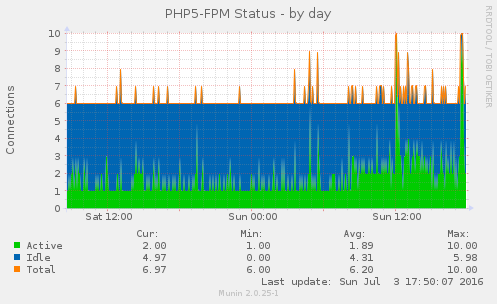
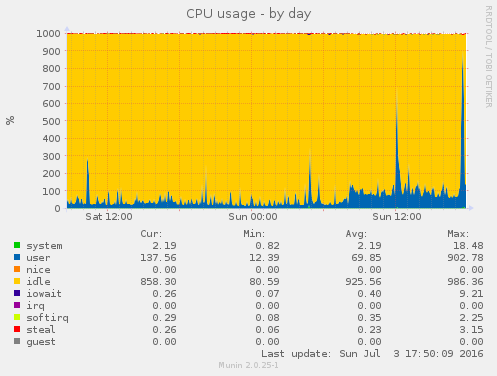
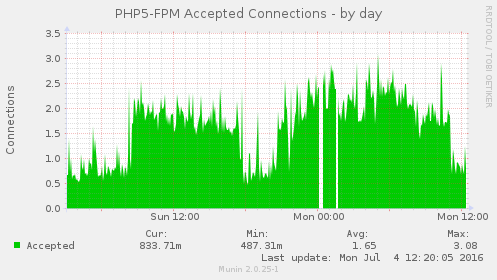
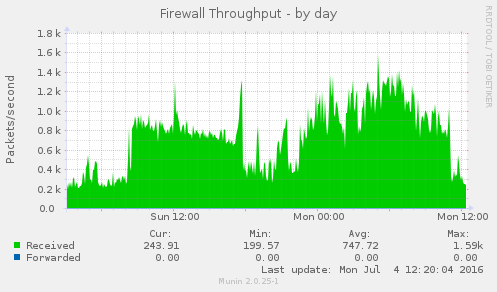
Some of the munin graphs illustrating what is going on:
I have restarted nginx, memcache and php5-fpm and tried running strace on onve of the php5-fpm processes which was using 100% of one CPU (see also ticket:73):
I don't know if the cause of this is external (the firewall graph indicate that it might be) or not.